Showing posts with label Volatility. Show all posts

Saturday, February 11, 2023

Hormel Foods' Lower Returns than the Vanguard S&P 500 Index ETF

Hormel Foods own several iconic brands shown in the images below.  


Source: Hormel Foods Corporation

Hormel Foods (HRL) has averaged a lower monthly return than the Vanguard S&P 500 Index ETF (VOO). The company has averaged a monthly return of 46 basis points compared to 105 basis points for the Vanguard S&P 500 Index ETF (Exhibits 1& 2).     

Exhibit 1:

Source: Data Provided by IEX Cloud, Author Calculations using Microsoft Excel

Exhibit 2:
Source: Data Provided by IEX Cloud, Author Calculations using Microsoft Excel

A linear regression of the monthly returns of the Vanguard S&P 500 Index ETF and Hormel Foods yields a beta of 0.237.  

Here's the output from the linear regression model created using RStudio:

Call:
lm(formula = HRL_Monthly_Return ~ VOO_Monthly_Return, data = VOOandHRL)

Residuals:
      Min        1Q    Median        3Q       Max 
-0.102639 -0.023972 -0.001719  0.022192  0.166993 

Coefficients:
                   Estimate Std. Error t value Pr(>|t|)
(Intercept)        0.002084   0.008249   0.253    0.802
VOO_Monthly_Return 0.237144   0.143102   1.657    0.105

Residual standard error: 0.0538 on 42 degrees of freedom
Multiple R-squared:  0.06137, Adjusted R-squared:  0.03902 
F-statistic: 2.746 on 1 and 42 DF,  p-value: 0.1049

The p-value of 0.1 indicates that the relationship is insignificant at the 95% confidence interval.

Between June 2019 and January 2023, the monthly returns of the Vanguard S&P 500 Index ETF and Hormel Foods had a positive correlation of 0.24. But between September 2020 and August 2021, the correlation was a negative 0.13 (Exhibit: 3). This was when stocks such as Apple, Microsoft, Amazon, and Tesla went on an epic, once-in-a-lifetime run into the trillion-dollar club in terms of market capitalization. Consumer staples stocks such as Hormel Foods went out of favor during this period, dropping 10.8%. 

Exhibit 3:

Source: Data Provided by IEX Cloud, Author Calculations using Microsoft Excel and RStudio
Hormel Foods may be the perfect stock to own during a bear market. Its low volatility and, at times, negative correlation with the S&P 500 Index means it performs well when the markets perform poorly.  


Monday, February 6, 2023

Clorox's Poor Average Monthly Returns

Clorox makes household products such as wipes, sprays, and bleach (Exhibit 1)

Exhibit 1: 

Source: Clorox Website

Over the past decade, Clorox has underperformed compared to the S&P 500 Index. An analysis of the monthly returns of Clorox and the Vanguard S&P 500 Index ETF between June 2019 and January 2023 shows that Clorox continued its poor performance. Clorox's monthly return averaged 0.1%, while the Vanguard S&P 500 Index returned 1% (Exhibits 2 & 3). Even the third quartile average monthly return of 3.2% of Clorox fell below the 4.8% returned by the Vanguard S&P 500 Index ETF (Exhibits 2 & 3).  

Exhibit 2:

Source: Data Provided by IEX Cloud, Author Calculations using Microsoft Excel


Exhibit 3:

Source: Data Provided by IEX Cloud, Author Calculations using Microsoft Excel

The monthly returns of Clorox and the Vanguard S&P 500 Index ETF between June 2019 and January 2023 show a low correlation of 0.24. 

A rolling correlation of the monthly returns conducted using RStudio shows a low positive correlation of 0.02 between August 2020 and July 2021 (Exhibit 4)

Exhibit 4:

Source: Data Provided by IEX Cloud, Author Calculations using Microsoft Excel, RStudio

 A linear regression of the monthly returns shows a very low beta of 0.25 for Clorox. But, the p-value of 0.1 shows that the relationship may not be significant at the 95% confidence interval.  

Call:

lm(formula = CLX_Monthly_Return ~ VOO_Monthly_Return, data = VOOandCLX)


Residuals:

      Min        1Q    Median        3Q       Max 

-0.141038 -0.033613  0.000236  0.036959  0.120780 


Coefficients:

                    Estimate Std. Error t value Pr(>|t|)

(Intercept)        -0.001581   0.008864  -0.178    0.859

VOO_Monthly_Return  0.252497   0.153777   1.642    0.108


Residual standard error: 0.05781 on 42 degrees of freedom

Multiple R-squared:  0.06032, Adjusted R-squared:  0.03795 

F-statistic: 2.696 on 1 and 42 DF,  p-value: 0.1081 

Here's the graph of the monthly returns of the Vanguard S&P 500 Index ETF and Clorox (Exhibit 5) and the residuals plot from the linear regression (Exhibit 6).

Exhibit 5:   

Source: Data Provided by IEX Cloud, Author Calculations using Microsoft Excel, RStudio

Exhibit 6:
Source: Data Provided by IEX Cloud, Author Calculations using Microsoft Excel, RStudio


Tuesday, January 31, 2023

Why is the stock of Goodyear Tire & Rubber Co. So Volatile?

Goodyear (GT) is a very volatile stock with a beta of 1.86, measured using a linear regression model. This linear regression model used monthly returns for Goodyear and the Vanguard S&P 500 Index ETF (VOO) from June 2019 to January 2023. This beta is one of the highest I have encountered among the stocks I cover (Exhibit 1).

Image: 90% Sustainable Material Demonstration Tire

Source: Goodyear Tire & Rubber Co.


The stock is heavily dependent on the discretionary spending of the consumer. In a downturn, car sales drop, thus affecting Goodyear's sales. The replacement tire sales also drop in an economic slowdown, affecting the company. These might be the reasons behind the high volatility.   

Note: Please click on the image to see an enlarged version.

Exhibit 1: Beta of Stocks in Industrial, Consumer Staples, Technology, and Consumer Discretionary Sectors  

Source: Data Provided by IEX Cloud, Author Calculations using Microsoft Excel & RStudio


Here's the output from the linear regression model:

Call:
lm(formula = GT_Monthly_Return ~ VOO_Monthly_Return, data = VOOandGT)

Residuals:
     Min       1Q   Median       3Q      Max 
-0.21099 -0.10456 -0.01782  0.07052  0.55012 

Coefficients:
                    Estimate Std. Error t value Pr(>|t|)    
(Intercept)        -0.008481   0.021853  -0.388      0.7    
VOO_Monthly_Return  1.869864   0.379106   4.932 1.33e-05 ***
---
Signif. codes:  0 ‘***’ 0.001 ‘**’ 0.01 ‘*’ 0.05 ‘.’ 0.1 ‘ ’ 1

Residual standard error: 0.1425 on 42 degrees of freedom
Multiple R-squared:  0.3668, Adjusted R-squared:  0.3517 
F-statistic: 24.33 on 1 and 42 DF,  p-value: 1.326e-05

The coefficient for "VOO_Monthly_Return" is the beta for the stock.  This coefficient is also the slope of the line.  The monthly returns of Goodyear have been plotted against the returns of the Vanguard S&P 500 Index ETF (Exhibit 2). Exhibit 3 shows the residuals from the linear regression mode. There is a solid positive monthly return correlation of 0.61 between the Vanguard ETF and Goodyear. There is also a significant relationship between the monthly returns of the Vanguard ETF and Goodyear, with a p-value of 1.3e-05.     

Exhibit 2: Monthly Returns Plot of the Vanguard S&P 500 Index ETF and Goodyear Tires

Source: Data Provided by IEX Cloud, Author Calculations Using Microsoft Excel, and Graph Plotted Using RStudio


Exhibit 3: Residuals from the Linear Regression of the Vanguard S&P 500 Index ETF and Goodyear Tires Monthly Returns
Source: Data Provided by IEX Cloud, Author Calculations Using Microsoft Excel, and Graph Plotted Using RStudio


Tuesday, December 13, 2022

Eastman Chemical's Monthly Returns Have a High Correlation with the Vanguard S&P 500 Index ETF

Here's the histogram of monthly returns for Eastman Chemical (EMN) between June 2019 and November 2022 (Exhibit 1). Please click on the image to see an enlarged version.  

Exhibit 1:

Eastman Chemical Histogram of Monthly Returns (Source: Data Provided by IEX Cloud, Author Calculations using Microsoft Excel)

  The average monthly returns of Eastman Chemical are slightly better than that of the Vanguard S&P 500 Index ETF (Exhibit 2 & 3). But Eastman Chemical has a much higher (nearly double) standard deviation (volatility) of monthly returns than the Vanguard S&P 500 Index ETF. 
     

Exhibit 2:

Eastman Chemical Average, First Quartile, Third Quartile, and Standard Deviation of Monthly Returns. (Data Provided by IEX Cloud, Author Calculations Using Microsoft Excel)

Exhibit 3:
Vanguard S&P 500 Index ETF Average, First Quartile, Third Quartile, and Standard Deviation of Monthly Returns. (Data Provided by IEX Cloud, Author Calculations Using Microsoft Excel)

Eastman Chemical moves closely with the market since it has a high positive correlation of 0.78.

> cor(VOOandEMN['EMN_Monthly_Return'], VOOandEMN['VOO_Monthly_Return'], method = c("pearson", "kendall", "spearman"))

                      VOO_Monthly_Return

EMN_Monthly_Return          0.7898654

A linear regression model of the monthly returns of Vanguard S&P 500 Index ETF as the independent variable and Eastman Chemical as the dependent variable yields a beta of 1.54.  

> # Conduct the Linear Regression of the Monthly Returns Between $VOO and $EMN

> lmVOOEMN = lm(EMN_Monthly_Return~VOO_Monthly_Return, data = VOOandEMN)

> # Present the summary of the results from the linear regression

> summary(lmVOOEMN)


Call:

lm(formula = EMN_Monthly_Return ~ VOO_Monthly_Return, data = VOOandEMN)


Residuals:

     Min       1Q   Median       3Q      Max 

-0.12433 -0.04969 -0.01148  0.05611  0.13701 


Coefficients:

                    Estimate Std. Error t value  Pr(>|t|)    

(Intercept)        -0.003992  0.010914   -0.366  0.716    

VOO_Monthly_Return  1.548548  0.190108    8.146  5.02e-10 ***

---

Signif. codes:  0 ‘***’ 0.001 ‘**’ 0.01 ‘*’ 0.05 ‘.’ 0.1 ‘ ’ 1


Residual standard error: 0.06942 on 40 degrees of freedom

Multiple R-squared:  0.6239, Adjusted R-squared:  0.6145 

F-statistic: 66.35 on 1 and 40 DF,  p-value: 5.023e-10

The coefficient of VOO_Monthly_Return (slope of the regression line) is the stock's beta. This beta value means that for every 1% change in the monthly returns of the Vanguard S&P 500 Index ETF, Eastman Chemical, on average, changes by 1.54% (monthly). This relationship between the two companies is significant at the 95% confidence interval, given the p-value of 5.02e-10.

This close positive relationship between the two explains why Eastman Chemical has lost 25.6%, while the Vanguard S&P 500 Index ETF (VOO) has lost 14.5%.    


Sunday, December 4, 2022

Reynolds Consumer Products Beta Included in the Latest List

Here's the beta list calculated using a linear regression model [Exhibit 1]. The beta is based on the monthly returns of the Vanguard S&P 500 Index ETF (Click on the image to see an enlarged version).  

Exhibit 1

(Source: Data Provided by IEX Cloud, Calculations Using, RStudio, Yahoo Finance)

Latest additions:

Saturday, October 1, 2022

Volatility of Monthly Returns of Timken Compared to the Vanguard S&P 500 Index ETF

Here is the graph of monthly returns between June 2019 and September 2022 of Timken (TKR) plotted against Vanguard S&P 500 Index ETF (VOO):

Exhibit: Monthly Returns of VOO and TKR between June 2019 and September 2022

Monthly Returns of VOO and TKR between June 2019 and September 2022
(Source: Data Provided by IEX Cloud, Monthly Returns Calculated in Microsoft Excel, Graph Plotted in R Studio using ggplot package)
Click on the image to enlarge it.

The monthly returns of Timken have a very strong positive correlation of 0.77 with the S&P 500 Index. The very low p-value (p = 6.2e-09) indicates that the monthly returns of the S&P 500 Index have an effect on Timken's monthly returns.  

The Beta value indicates the monthly return volatility of Timken compared to the S&P 500 Index. Yahoo Finance provides a Beta value of 1.59 based on monthly returns over the past five years. A linear regression of the monthly returns between June 2019 and September 2022 yields a Beta of 1.48. The coefficient of Vanguard's monthly return is the volatility of Timken. The coefficient is the linear regression line's slope and Timken's Beta value. In other words, as the monthly return of the Vanguard S&P 500 Index ETF changes by 1%, Timken's monthly return can change by an average of 1.48%.  

Timken's Beta value is one of the highest I have seen. Here are the Beta values of some of the stocks in another post on this blog.  

Here's the output of the linear regression between the monthly returns of Vanguard S&P 500 Index ETF and Timken:

Call:

lm(formula = TKR_Monthly_Return ~ VOO_Monthly_Return, data = VOOandTKR)

Residuals:

      Min        1Q    Median        3Q       Max 

-0.132602 -0.047815 -0.000585  0.059694  0.137770 

Coefficients:

                   Estimate Std. Error t value Pr(>|t|)    

(Intercept)        0.001198   0.011348   0.106    0.916    

VOO_Monthly_Return 1.489061   0.199966   7.447 6.17e-09 ***

---

Signif. codes:  0 ‘***’ 0.001 ‘**’ 0.01 ‘*’ 0.05 ‘.’ 0.1 ‘ ’ 1

Residual standard error: 0.07103 on 38 degrees of freedom

Multiple R-squared:  0.5934, Adjusted R-squared:  0.5827 

F-statistic: 55.45 on 1 and 38 DF,  p-value: 6.168e-09  


Tuesday, September 27, 2022

Boeing's Monthly Return Volatility Compared to the Vanguard S&P 500 Index ETF From June 2019 to August 2022

 Given its dominant position in the aerospace market, one would think Boeing's (BA) monthly returns would be less volatile than the S&P 500 index (VOO). But, Boeing has endured a lot in the past few years. First came the trade war with China that froze Boeing out of the second-largest aerospace market in the world.  Then came the COVID-19 pandemic that grounded airlines worldwide and brought Boeing to its knees. We did not even talk about the 737 Max plane crash in Ethiopia that kicked off the disastrous few years for Boeing.  

Boeing has never fully recovered from either the trade war or the pandemic. Boeing remains frozen out of the Chinese market, and airlines are only now seeing air travel return close to pre-pandemic levels (Exhibit 1).

Exhibit 1: TSA Checkpoint Travel Number September 17, 2022 - September 26, 2022

TSA Checkpoint Travel Number September 17, 2022 - September 26, 2022
TSA Checkpoint Travel Numbers (Source: TSA.GOV)


Now, the world is grappling with slowing growth due to high inflation and interest rates, which is putting further pressure on Boeing. By the looks of it, Boeing stock may take a decade or more to recover its losses if it ever recovers. Boeing's stock has dropped from $440 in March 2019 to $127 as of September 27 - a loss of 71%.  
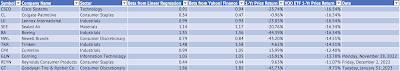
Due to these massive crises, Boeing's stock returns have become unhinged from that of the S&P 500 index. A linear regression of the monthly returns of the Vanguard S&P 500 Index and Boeing yields a very high beta of 1.35 (slope of the regression line). The value of 1.35 is the coefficient of the monthly returns of the Vanguard S&P 500 Index ETF (VOO).  Yahoo Finance displays a beta of 1.36 based on 5-year monthly returns.  One can expect any change in the Vanguard ETF to be magnified by Boeing.  For every 1% change in monthly returns of the S&P 500 index, Boeing's monthly returns are expected to change by 1.35%. Also, just 25% (Adjusted R-Squared in the RStudio output below) of Boeing's returns are explained by the monthly returns of the S&P 500 Index.  

Exhibit: Vanguard S&P 500 Index ETF and Boeing Monthly Returns [June 2019 - August 2022]

Vanguard S&P 500 Index ETF and Boeing Monthly Returns [June 2019 - August 2022]
(Source: Data Provided by IEX Cloud, Author Calculations Using RStudio)

Here's the output from the linear regression conducted on RStudio: 

> lmBAVOO = lm(BA_Monthly_Return~VOO_Monthly_Return, data = VOOandBA)

> summary(lmBAVOO)

Call:

lm(formula = BA_Monthly_Return ~ VOO_Monthly_Return, data = VOOandBA)


Residuals:

     Min       1Q   Median       3Q      Max 

-0.26036 -0.07433 -0.00562  0.07323  0.33452 


Coefficients:

                   Estimate Std. Error t value Pr(>|t|)    

(Intercept)        -0.02348    0.02007  -1.169 0.249682    

VOO_Monthly_Return  1.35442    0.36247   3.737 0.000628 ***

---

Signif. codes:  0 ‘***’ 0.001 ‘**’ 0.01 ‘*’ 0.05 ‘.’ 0.1 ‘ ’ 1


Residual standard error: 0.1229 on 37 degrees of freedom

Multiple R-squared:  0.274, Adjusted R-squared:  0.2543 

F-statistic: 13.96 on 1 and 37 DF,  p-value: 0.0006279


Wednesday, September 21, 2022

Linear Regression of Monthly Returns of Sealed Air Corp and the Vanguard S&P 500 Index ETF

Sealed Air Corporation is a global provider of packaging solutions to various industries. The company provides various packaging products to pack red meat, medical and life science products, cheese, electronics, and other products.  

Exhibit: Sealed Air Corporation Revenue by Region and Product Type

Exhibit: Sealed Air Corporation Packaging Products Revenue by Region and Product Type
(Source: Sealed Air Q2 FY 2022 Investor Presentation on August 2,2022)

Sealed Air has very high volatility. This high volatility may be due to heavy dependency on consumer spending. If consumer spending is weak, they may buy less packaged red meat or packaged cheese, resulting in reduced revenue for the company.  

Here is the graph of monthly returns of Sealed Air (SEE) plotted against Vanguard S&P 500 Index ETF (VOO):
Exhibit 1: Monthly Returns of Sealed Air Corp. and Vanguard S&P 500 Index ETF [June 2019 -  August 2022]
Monthly Returns of Sealed Air Corp. and Vanguard S&P 500 Index ETF [June 2019 -  August 2022]
Monthly Returns of Sealed Air Corp. and Vanguard S&P 500 Index ETF [June 2019 -  August 2022]
(Source: RStudio, ggplot, Data Provided by IEX Cloud)


Results of the linear regression of monthly returns of Sealed Air Corporation against Vanguard S&P 500 Index ETF:

> lmSEEVOO = lm(SEE_Monthly_Return~VOO_Monthly_Return, data = VOOandSEE)
> summary(lmSEEVOO)

Call:
lm(formula = SEE_Monthly_Return ~ VOO_Monthly_Return, data = VOOandSEE)

Residuals:
     Min       1Q   Median       3Q      Max 
-0.13572 -0.03866  0.01319  0.03375  0.14587 

Coefficients:
                    Estimate Std. Error t value Pr(>|t|)    
(Intercept)        -0.002498   0.009056  -0.276    0.784    
VOO_Monthly_Return  1.144479   0.163536   6.998 2.85e-08 ***
---
Signif. codes:  0 ‘***’ 0.001 ‘**’ 0.01 ‘*’ 0.05 ‘.’ 0.1 ‘ ’ 1

Residual standard error: 0.05547 on 37 degrees of freedom
Multiple R-squared:  0.5696, Adjusted R-squared:  0.558 
F-statistic: 48.98 on 1 and 37 DF,  p-value: 2.849e-08

Sealed Air Corporation has a higher volatility than the S&P 500 Index, with a Beta of 1.144. The company's monthly returns positively correlate with the Vanguard S&P 500 Index ETF. The correlation is 0.75.  
The linear regression yields an adjusted R-squared of 0.55, indicating that about 55% of Sealed Air's monthly returns can be explained by the monthly returns of the S&P 500 Index. 
Sealed Air stock may be risky due to its high volatility compared to the market. But, if the stocks are bought at a reasonable or low valuation, they may yield returns that exceed the market's return.   


Tuesday, September 20, 2022

Linear Regression of Monthly Returns of Cisco Systems and the Vanguard S&P 500 Index ETF

Here is the graph of monthly returns of Cisco Systems (CSCO) plotted against Vanguard S&P 500 Index ETF (VOO):

Exhibit 1: Monthly Returns of Cisco Systems and Vanguard S&P 500 Index ETF [June 2019 -  August 2022]

Monthly Returns of the Vanguard S&P 500 Index ETF and Cisco Systems
Monthly Returns of the Vanguard S&P 500 Index ETF and Cisco Systems Inc.

(Source: RStudio, ggplot, Data Provided by IEX Cloud)

Results of the linear regression of monthly returns of Cisco Systems against Vanguard S&P 500 Index ETF:

VOOandCSCO <- read_excel("/CSCO_VOO_LM_September_2022.xlsx", sheet = "Sheet1")
lmCSCOVOO = lm(CSCO_Monthly_Return~VOO_Monthly_Return, data = VOOandCSCO)
summary(lmCSCOVOO)

Call:
lm(formula = CSCO_Monthly_Return ~ VOO_Monthly_Return, data = VOOandCSCO)

Residuals:
      Min        1Q    Median        3Q       Max 
-0.156924 -0.031998 -0.008248  0.038045  0.127839 

Coefficients:
                   Estimate Std. Error t value Pr(>|t|)    
(Intercept)        -0.01062    0.01049  -1.012    0.318    
VOO_Monthly_Return  0.91708    0.18946   4.841 2.31e-05 ***
---
Signif. codes:  0 ‘***’ 0.001 ‘**’ 0.01 ‘*’ 0.05 ‘.’ 0.1 ‘ ’ 1

Residual standard error: 0.06426 on 37 degrees of freedom
Multiple R-squared:  0.3877, Adjusted R-squared:  0.3712 
F-statistic: 23.43 on 1 and 37 DF,  p-value: 2.306e-05

The slope of the regression corresponds to the beta of the stock. In this case, Cisco Systems has a beta of 0.91. 
The adjusted R-squared is 0.37. About 37% of Cisco's monthly return is explained by the returns of the S&P 500 index.  
Cisco Systems cannot protect a portfolio against market volatility since it has a beta value close to 1. Cisco's stock will almost entirely reflect the volatility in the market.      


Monday, September 5, 2022

Linear Regression of Monthly Returns of Colgate-Palmolive against Vanguard S&P 500 Index ETF

Here is the graph of monthly returns of Colgate-Palmolive (CL) plotted against Vanguard S&P 500 Index ETF (VOO):

Exhibit 1: Monthly Returns of Colgate-Palmolive and Vanguard S&P 500 Index ETF [June 2019 -  August 2022]

(Source: RStudio, ggplot, Data Provided by IEX Cloud)

Results of the linear regression of monthly returns of Colgate-Palmolive against Vanguard S&P 500 Index ETF:

> VOOandCL <- read_excel("/CL_VOO_LM_September_2022.xlsx", sheet = "Sheet1")
lmCLVOO = lm(CL_Monthly_Return~VOO_Monthly_Return, data = VOOandCL)

> summary(lmCLVOO)

Call:
lm(formula = CL_Monthly_Return ~ VOO_Monthly_Return, data = VOOandCL)

Residuals:
      Min        1Q    Median        3Q       Max 
-0.084505 -0.025451  0.002263  0.028820  0.122836 

Coefficients:
                    Estimate Std. Error t value Pr(>|t|)   
(Intercept)        0.0002236  0.0067940   0.033  0.97392   
VOO_Monthly_Return 0.3471172  0.1226847   2.829  0.00749 **
---
Signif. codes:  0 ‘***’ 0.001 ‘**’ 0.01 ‘*’ 0.05 ‘.’ 0.1 ‘ ’ 1

Residual standard error: 0.04161 on 37 degrees of freedom
Multiple R-squared:  0.1779, Adjusted R-squared:  0.1557 
F-statistic: 8.005 on 1 and 37 DF,  p-value: 0.007492

The slope of the regression corresponds to the beta of the stock. In this case, Colgate-Palmolive has a beta of 0.34. 
The adjusted R-squared is 0.15. About 15% of Colgate-Palmolive's return is explained by the returns of the S&P 500 index.  
Colgate-Palmolive can protect a portfolio against market volatility since it has a beta value substantially less than 1.    


Saturday, September 3, 2022

Linear Regression of Monthly Returns of Lennox International against Vanguard S&P 500 Index ETF

Here is the graph of monthly returns of Lennox International (LII) plotted against Vanguard S&P 500 Index ETF (VOO):

Exhibit 1: Monthly Returns of Lennox International and Vanguard S&P 500 Index ETF [June 2019 -  August 2022 


(Source: RStudio, ggplot, Data Provided by IEX Cloud)

Results of the linear regression of monthly returns of Lennox International against Vanguard S&P 500 Index ETF:

VOOandLII <- read_excel("/LII_VOO_LM_September_2022.xlsx", sheet = "Sheet1")

lmLIIVOO = lm(LII_Monthly_Return~VOO_Monthly_Return, data = VOOandLII)

> summary(lmLIIVOO)

Call:
lm(formula = LII_Monthly_Return ~ VOO_Monthly_Return, data = VOOandLII)

Residuals:
      Min        1Q    Median        3Q       Max 
-0.090246 -0.052733 -0.001907  0.040310  0.108446 

Coefficients:
                    Estimate Std. Error t value Pr(>|t|)    
(Intercept)        -0.010082   0.009416  -1.071    0.291    
VOO_Monthly_Return  0.995050   0.170040   5.852 9.97e-07 ***
---
Signif. codes:  0 ‘***’ 0.001 ‘**’ 0.01 ‘*’ 0.05 ‘.’ 0.1 ‘ ’ 1

Residual standard error: 0.05767 on 37 degrees of freedom
Multiple R-squared:  0.4807, Adjusted R-squared:  0.4666 
F-statistic: 34.24 on 1 and 37 DF,  p-value: 9.966e-07

The slope of the regression corresponds to the beta of the stock. In this case, Lennox International has a beta of 0.995. Lennox's beta is close to the S&P 500 beta, so Lennox will move in line with the market.  

The adjusted R-squared is 0.46. About 46% of Lennox's return is explained by the returns of the S&P 500 index.  


Paccar: Peak Demand For Trucks

 Paccar ( PCAR ) produced 185,900 trucks in 2022 and is on track for another record year in 2023. The company has experienced good revenue ...