Thursday, December 15, 2022

J.M. Smucker's Low Correlation With The Vanguard S&P 500 Index ETF

 J.M. Smucker is known for its iconic and timeless consumer staples brands (Exhibit 1)

Note: Click on each image in this blog post to view an enlarged version

Exhibit 1:

Brands Owned by J.M. Smucker & Co. (Source: J.M. Smucker)

Here's the histogram of monthly returns for J.M. Smucker between June 2019 and November 2022 (Exhibit 2).


Exhibit 2:

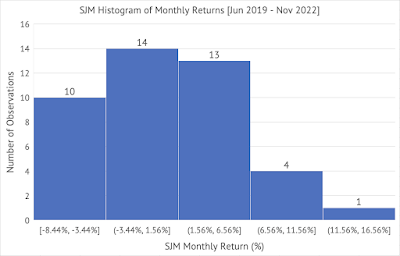
J.M. Smucker (SJM) Histogram of Monthly Returns (Source: Data provided by IEX Cloud, author calculations & graph using Microsoft Excel)

The average monthly return for J.M. Smucker is less than the Vanguard S&P 500 Index ETF (Exhibit 3).
Exhibit 3:
 J.M. Smucker Monthly Return Statistics - Average, First Quartile, Third Quartile, Standard Deviation, Highest Monthly Return, Lowest Monthly Return (Source: Data provided by IEX Cloud, author calculations & graph using Microsoft Excel)

J.M. Smucker had a lower standard deviation than the Vanguard ETF during this period (Exhibit 4). A company with a lower standard deviation than the well-diversified ETF, a measure of volatility, is an infrequent occurrence. 

Exhibit 4:
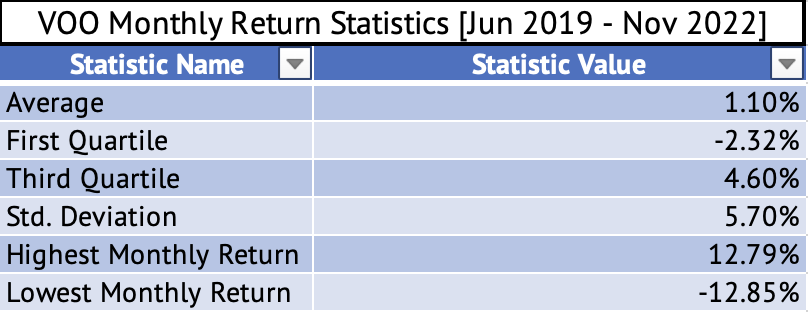
Vanguard S&P 500 Index ETF Monthly Return Statistics - Average, First Quartile, Third Quartile, Standard Deviation, Highest Monthly Return, Lowest Monthly Return (Source: Data provided by IEX Cloud, author calculations & graph using Microsoft Excel)

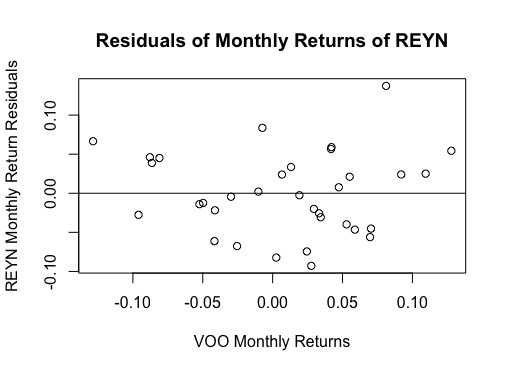
Here's a graph of the monthly returns of the Vanguard ETF (x-axis) and J.M.Smucker (y-axis) with the fitted regression line (Exhibit 5).
Exhibit 5:
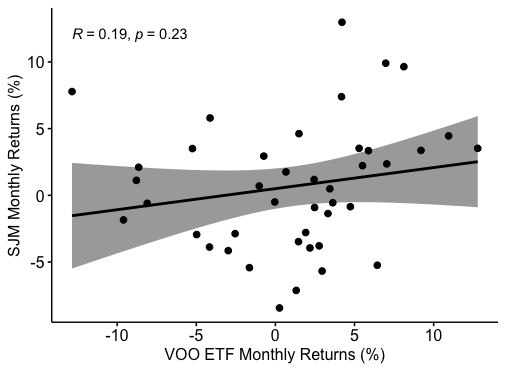
Monthly Return Graph of the Vanguard S&P 500 Index ETF and J.M. Smucker (Source: Data provided by IEX Cloud, author calculations & graph using Microsoft Excel & RStudio) 

The correlation of the monthly returns between June 2019 and November 2022 between the Vanguard ETF and J.M. Smucker is a low 0.19 (Exhibit 5). The fitted linear regression line has a p-value of 0.23, indicating that the relationship is insignificant at the 95% confidence interval. 

The fitted linear regression line has a p-value of 0.23, indicating that the relationship is insignificant at the 95% confidence interval. Here's the output from the linear regression:

> summary(lmVOOSJM)

Call:
lm(formula = SJM_Monthly_Return ~ VOO_Monthly_Return, data = VOOandSJM)

Residuals:
      Min        1Q    Median        3Q       Max 
-0.089842 -0.034389  0.002403  0.022171  0.118077 

Coefficients:
                   Estimate  Std. Error t value  Pr(>|t|)
(Intercept)        0.005011   0.007476   0.670    0.507
VOO_Monthly_Return 0.157911   0.130216   1.213    0.232

Residual standard error: 0.04755 on 40 degrees of freedom
Multiple R-squared:  0.03546, Adjusted R-squared:  0.01135 
F-statistic: 1.471 on 1 and 40 DF,  p-value: 0.2324

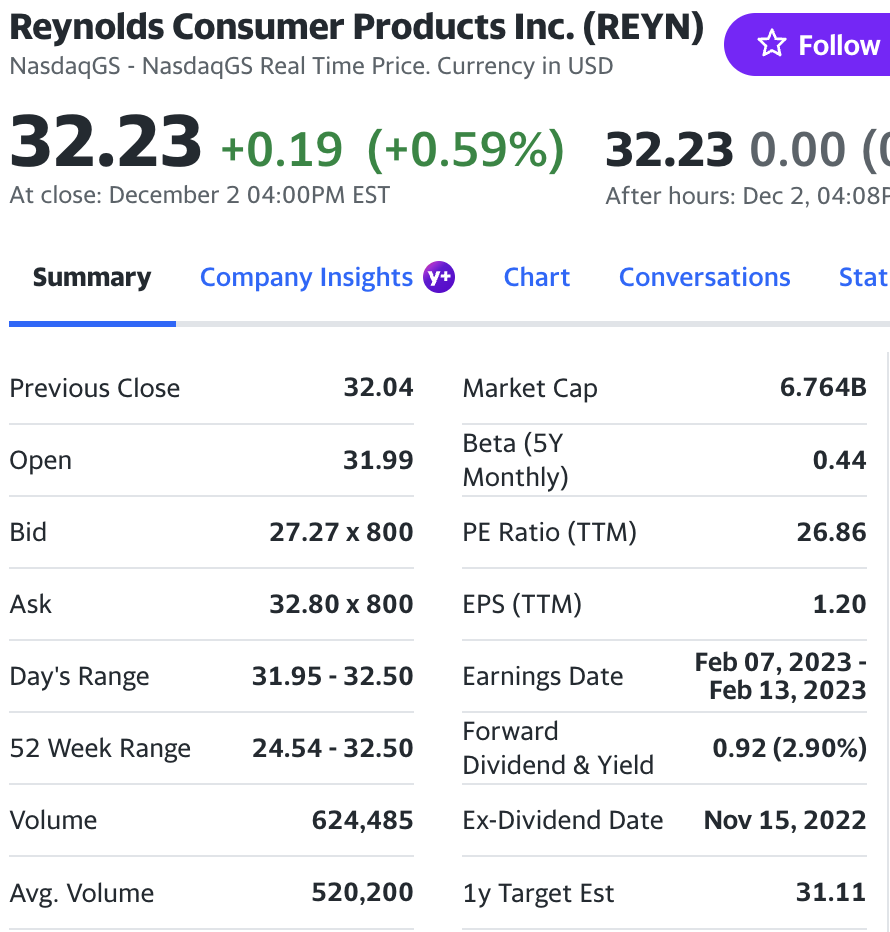
The beta for J.M. Smucker is 0.15, but the high p-value is a concern. This beta (the coefficient of VOO_Monthly_Return) may not be the true value. Yahoo Finance has calculated a beta of 0.24.    


Tuesday, December 13, 2022

Eastman Chemical's Monthly Returns Have a High Correlation with the Vanguard S&P 500 Index ETF

Here's the histogram of monthly returns for Eastman Chemical (EMN) between June 2019 and November 2022 (Exhibit 1). Please click on the image to see an enlarged version.  

Exhibit 1:

Eastman Chemical Histogram of Monthly Returns (Source: Data Provided by IEX Cloud, Author Calculations using Microsoft Excel)

  The average monthly returns of Eastman Chemical are slightly better than that of the Vanguard S&P 500 Index ETF (Exhibit 2 & 3). But Eastman Chemical has a much higher (nearly double) standard deviation (volatility) of monthly returns than the Vanguard S&P 500 Index ETF. 
     

Exhibit 2:

Eastman Chemical Average, First Quartile, Third Quartile, and Standard Deviation of Monthly Returns. (Data Provided by IEX Cloud, Author Calculations Using Microsoft Excel)

Exhibit 3:
Vanguard S&P 500 Index ETF Average, First Quartile, Third Quartile, and Standard Deviation of Monthly Returns. (Data Provided by IEX Cloud, Author Calculations Using Microsoft Excel)

Eastman Chemical moves closely with the market since it has a high positive correlation of 0.78.

> cor(VOOandEMN['EMN_Monthly_Return'], VOOandEMN['VOO_Monthly_Return'], method = c("pearson", "kendall", "spearman"))

                      VOO_Monthly_Return

EMN_Monthly_Return          0.7898654

A linear regression model of the monthly returns of Vanguard S&P 500 Index ETF as the independent variable and Eastman Chemical as the dependent variable yields a beta of 1.54.  

> # Conduct the Linear Regression of the Monthly Returns Between $VOO and $EMN

> lmVOOEMN = lm(EMN_Monthly_Return~VOO_Monthly_Return, data = VOOandEMN)

> # Present the summary of the results from the linear regression

> summary(lmVOOEMN)


Call:

lm(formula = EMN_Monthly_Return ~ VOO_Monthly_Return, data = VOOandEMN)


Residuals:

     Min       1Q   Median       3Q      Max 

-0.12433 -0.04969 -0.01148  0.05611  0.13701 


Coefficients:

                    Estimate Std. Error t value  Pr(>|t|)    

(Intercept)        -0.003992  0.010914   -0.366  0.716    

VOO_Monthly_Return  1.548548  0.190108    8.146  5.02e-10 ***

---

Signif. codes:  0 ‘***’ 0.001 ‘**’ 0.01 ‘*’ 0.05 ‘.’ 0.1 ‘ ’ 1


Residual standard error: 0.06942 on 40 degrees of freedom

Multiple R-squared:  0.6239, Adjusted R-squared:  0.6145 

F-statistic: 66.35 on 1 and 40 DF,  p-value: 5.023e-10

The coefficient of VOO_Monthly_Return (slope of the regression line) is the stock's beta. This beta value means that for every 1% change in the monthly returns of the Vanguard S&P 500 Index ETF, Eastman Chemical, on average, changes by 1.54% (monthly). This relationship between the two companies is significant at the 95% confidence interval, given the p-value of 5.02e-10.

This close positive relationship between the two explains why Eastman Chemical has lost 25.6%, while the Vanguard S&P 500 Index ETF (VOO) has lost 14.5%.    


Saturday, December 10, 2022

Monthly Return Analysis of Conagra Brands

Conagra Brands owns many iconic brands in the food business (Exhibit 1). The company is categorized as a consumer staple. 

Exhibit 1:


Here's the histogram of monthly returns of Conagra Brands between June 2019 and November 2022 (Exhibit 2). Please click on the image to see an enlarged version.  

Exhibit 2:

Conagra Brands Histogram of Monthly Returns (Source: Data Provided by IEX Cloud, Author Calculations using Excel)

The average monthly returns of Conagra Brands (Exhibit 3) are very similar to that of the Vanguard S&P 500 Index ETF (Exhibit 4).

Exhibit 3: 

(Source: Data Provided by IEX Cloud, Data Calculations Using Excel)

Exhibit 4:

(Source: Data Provided by IEX Cloud, Data Calculations Using Excel)

The monthly returns of Conagra Brands and the Vanguard S&P 500 Index ETF have a mild positive correlation of 0.27 (Exhibit 5)

Exhibit 5:  


A 12-month rolling correlation of the monthly returns yielded a very high positive correlation of 0.8 between April 2020 and March 2021 (Exhibit 6).

Exhibit 6:

(Source: Data Provided by IEX Cloud, Correlation Calculations Using RStudio)

A 12-month rolling correlation of the monthly returns yielded the highest negative correlation of 0.37 between July 2021 and June 2022 (Exhibit 7).

Exhibit 7:

(Source: Data Provided by IEX Cloud, Correlation Calculations Using RStudio)

A linear regression model estimates Conagra's Beta at 0.34, which is not statistically significant at the 95% confidence interval. The p-value is 0.083, suggesting that the correlation is not statistically significant.

Here's the output of the linear model:

Call:
lm(formula = CAG_Monthly_Return ~ VOO_Monthly_Return, data = VOOandCAG)

Residuals:
      Min        1Q    Median        3Q       Max 
-0.168638  -0.044057  -0.004737   0.045175  0.170379 

Coefficients:
                   Estimate Std. Error t value Pr(>|t|)  
(Intercept)        0.007141   0.011079   0.645   0.5229  
VOO_Monthly_Return 0.342593   0.192981   1.775   0.0835 .
---
Signif. codes:  0 ‘***’ 0.001 ‘**’ 0.01 ‘*’ 0.05 ‘.’ 0.1 ‘ ’ 1

Residual standard error: 0.07047 on 40 degrees of freedom
Multiple R-squared:  0.07303, Adjusted R-squared:  0.04986 
F-statistic: 3.152 on 1 and 40 DF,  p-value: 0.08346

The adjusted R-squared is 0.049, meaning that just 4.9% of Conagra's monthly returns can be explained by the monthly returns of the Vanguard S&P 500 Index ETF.    


Sunday, December 4, 2022

Reynolds Consumer Products Beta Included in the Latest List

Here's the beta list calculated using a linear regression model [Exhibit 1]. The beta is based on the monthly returns of the Vanguard S&P 500 Index ETF (Click on the image to see an enlarged version).  

Exhibit 1

(Source: Data Provided by IEX Cloud, Calculations Using, RStudio, Yahoo Finance)

Latest additions:

Mothly Return Volatility (Beta) of Reynolds Consumer Products

Reynolds Consumer Products (REYN) makes many iconic household products, such as Reynolds Wrap, Hefty waste bags, and FreshLock zipper bags [Exhibit 1]

Exhibit 1: Some of the Products Made by Reynolds Consumer Products Co.

Reynolds Consumer Products Source: Reynolds brands 

 I analyzed the monthly return of Reynolds (REYN) between February 2020 and November 2022. Here's the histogram of the monthly returns (click on the image to see an enlarged version) [Exhibit 2]:

Exhibit 2

Source: Data Provided by IEX Cloud, Author Calculations and Graphs Using Microsoft Excel 

Here's the graph of the monthly returns of the Vanguard S&P 500 Index ETF (VOO) on the x-axis and Reynold's monthly returns on the y-axis [Exhibit 3]:

Exhibit 3

Source: Data Provided by IEX Cloud, Graph Created using RStudio

The Pearson correlation of the monthly returns is a positive 0.46. This correlation value can be considered to have medium strength. This correlation is statistically significant at the 95% confidence interval with a p-value of 0.0057.  

A linear regression of the monthly returns of Reynolds and the Vanguard S&P 500 Index ETF yields a beta value of 0.44. This beta value means that for every 1% change in the value of the Vanguard ETF, on average, Reynolds' stock will change by 0.44%. Yahoo Finance also shows a beta of 0.44 [Exhibit 4]

Exhibit 4

Source: Yahoo Finance

The adjusted R-squared value provided by the linear regression is 0.19. This adjusted R-squared value indicates that about 19% of Reynold's monthly returns are explained by the monthly returns of the Vanguard S&P 500 Index ETF.  

Here's the output from the linear regression model constructed using RStudio:

Call:

lm(formula = REYN_Monthly_Return ~ VOO_Monthly_Return, data = VOOandREYN_MonthlyReturns)

Residuals:

      Min        1Q    Median        3Q       Max 

-0.092919 -0.037524 -0.003499  0.037494  0.137349 

Coefficients:

                   Estimate Std. Error t value Pr(>|t|)   

(Intercept)        0.001072   0.009234   0.116  0.90828   

VOO_Monthly_Return 0.440311   0.148653   2.962  0.00572 **

---

Signif. codes:  0 ‘***’ 0.001 ‘**’ 0.01 ‘*’ 0.05 ‘.’ 0.1 ‘ ’ 1

Residual standard error: 0.05329 on 32 degrees of freedom

Multiple R-squared:  0.2152, Adjusted R-squared:  0.1907 

F-statistic: 8.773 on 1 and 32 DF,  p-value: 0.005722

The p-value is significant at a 95% confidence interval with a value of 0.005722. 

Here's the residuals plot for the linear regression between Reynolds Consumer Products and the Vanguard S&P 500 Index ETF [Exhibit 5]:

Exhibit 5

Residuals Plot for Linear Regression of the monthly returns of the Vanguard S&P 500 Index as the independent variable and Reynold Consumer Products (Source: Data Provided by IEX Cloud, Graph Created using RStudio)

  Here are the average, first quartile, third quartile, and standard deviation of Reynold's monthly returns [Exhibit 6]:

Exhibit 6


Here are the average, first quartile, third quartile, and standard deviation of the Vanguard S&P 500 Index ETF [Exhibit 7]:

Exhibit 7


Paccar: Peak Demand For Trucks

 Paccar ( PCAR ) produced 185,900 trucks in 2022 and is on track for another record year in 2023. The company has experienced good revenue ...