Showing posts with label S&P 500 Index. Show all posts

Saturday, February 11, 2023

Hormel Foods' Lower Returns than the Vanguard S&P 500 Index ETF

Hormel Foods own several iconic brands shown in the images below.  


Source: Hormel Foods Corporation

Hormel Foods (HRL) has averaged a lower monthly return than the Vanguard S&P 500 Index ETF (VOO). The company has averaged a monthly return of 46 basis points compared to 105 basis points for the Vanguard S&P 500 Index ETF (Exhibits 1& 2).     

Exhibit 1:

Source: Data Provided by IEX Cloud, Author Calculations using Microsoft Excel

Exhibit 2:
Source: Data Provided by IEX Cloud, Author Calculations using Microsoft Excel

A linear regression of the monthly returns of the Vanguard S&P 500 Index ETF and Hormel Foods yields a beta of 0.237.  

Here's the output from the linear regression model created using RStudio:

Call:
lm(formula = HRL_Monthly_Return ~ VOO_Monthly_Return, data = VOOandHRL)

Residuals:
      Min        1Q    Median        3Q       Max 
-0.102639 -0.023972 -0.001719  0.022192  0.166993 

Coefficients:
                   Estimate Std. Error t value Pr(>|t|)
(Intercept)        0.002084   0.008249   0.253    0.802
VOO_Monthly_Return 0.237144   0.143102   1.657    0.105

Residual standard error: 0.0538 on 42 degrees of freedom
Multiple R-squared:  0.06137, Adjusted R-squared:  0.03902 
F-statistic: 2.746 on 1 and 42 DF,  p-value: 0.1049

The p-value of 0.1 indicates that the relationship is insignificant at the 95% confidence interval.

Between June 2019 and January 2023, the monthly returns of the Vanguard S&P 500 Index ETF and Hormel Foods had a positive correlation of 0.24. But between September 2020 and August 2021, the correlation was a negative 0.13 (Exhibit: 3). This was when stocks such as Apple, Microsoft, Amazon, and Tesla went on an epic, once-in-a-lifetime run into the trillion-dollar club in terms of market capitalization. Consumer staples stocks such as Hormel Foods went out of favor during this period, dropping 10.8%. 

Exhibit 3:

Source: Data Provided by IEX Cloud, Author Calculations using Microsoft Excel and RStudio
Hormel Foods may be the perfect stock to own during a bear market. Its low volatility and, at times, negative correlation with the S&P 500 Index means it performs well when the markets perform poorly.  


Monday, February 6, 2023

Clorox's Poor Average Monthly Returns

Clorox makes household products such as wipes, sprays, and bleach (Exhibit 1)

Exhibit 1: 

Source: Clorox Website

Over the past decade, Clorox has underperformed compared to the S&P 500 Index. An analysis of the monthly returns of Clorox and the Vanguard S&P 500 Index ETF between June 2019 and January 2023 shows that Clorox continued its poor performance. Clorox's monthly return averaged 0.1%, while the Vanguard S&P 500 Index returned 1% (Exhibits 2 & 3). Even the third quartile average monthly return of 3.2% of Clorox fell below the 4.8% returned by the Vanguard S&P 500 Index ETF (Exhibits 2 & 3).  

Exhibit 2:

Source: Data Provided by IEX Cloud, Author Calculations using Microsoft Excel


Exhibit 3:

Source: Data Provided by IEX Cloud, Author Calculations using Microsoft Excel

The monthly returns of Clorox and the Vanguard S&P 500 Index ETF between June 2019 and January 2023 show a low correlation of 0.24. 

A rolling correlation of the monthly returns conducted using RStudio shows a low positive correlation of 0.02 between August 2020 and July 2021 (Exhibit 4)

Exhibit 4:

Source: Data Provided by IEX Cloud, Author Calculations using Microsoft Excel, RStudio

 A linear regression of the monthly returns shows a very low beta of 0.25 for Clorox. But, the p-value of 0.1 shows that the relationship may not be significant at the 95% confidence interval.  

Call:

lm(formula = CLX_Monthly_Return ~ VOO_Monthly_Return, data = VOOandCLX)


Residuals:

      Min        1Q    Median        3Q       Max 

-0.141038 -0.033613  0.000236  0.036959  0.120780 


Coefficients:

                    Estimate Std. Error t value Pr(>|t|)

(Intercept)        -0.001581   0.008864  -0.178    0.859

VOO_Monthly_Return  0.252497   0.153777   1.642    0.108


Residual standard error: 0.05781 on 42 degrees of freedom

Multiple R-squared:  0.06032, Adjusted R-squared:  0.03795 

F-statistic: 2.696 on 1 and 42 DF,  p-value: 0.1081 

Here's the graph of the monthly returns of the Vanguard S&P 500 Index ETF and Clorox (Exhibit 5) and the residuals plot from the linear regression (Exhibit 6).

Exhibit 5:   

Source: Data Provided by IEX Cloud, Author Calculations using Microsoft Excel, RStudio

Exhibit 6:
Source: Data Provided by IEX Cloud, Author Calculations using Microsoft Excel, RStudio


Saturday, February 4, 2023

Change in Correlation of the Monthly Returns of Generac Holdings and the Vanguard S&P 500 Index ETF

Generac Holdings (GNRC) has a beta of 1.19 based on a linear regression model of the monthly returns of the Vanguard S&P 500 Index ETF (VOO) and Generac Holdings. The company's residential sales slowdown has pushed the stock lower over the past five months. The stock has dropped 55% compared to a 7% drop for the Vanguard S&P 500 Index ETF over the past year. This massive underperformance of the stock has led to a drop in the monthly return correlation of the Vanguard ETF and Generac Holdings.  

     Exhibit 1: A Generac Generator

Source: Generac Holdings Inc.
Here's the graph of the Vanguard S&P 500 Index ETF and Generac Holdings' monthly returns (Exhibit 2).  

Exhibit 2: Monthly Returns of the Vanguard S&P 500 Index ETF and Generac Holdings

Source: Data Provided by IEX Cloud, Author Calculations on Microsoft Excel, Graph Created on RStudio

The graph of the monthly returns also shows a correlation of 0.44 between the two equities.  
Here are the betas of some of the stocks I have covered over the past few months (Exhibit 3)

Note: Click on each image to see an enlarged version. 
 
Exhibit 3: Beta of Various stocks in the consumer staples, consumer discretionary, and industrial sectors.   
Source: Data Provided by IEX Cloud, Author Calculations using Microsoft Excel and RStudio

Here's the output from the linear regression model:

Call:
lm(formula = GNRC_Monthly_Return ~ VOO_Monthly_Return, data = VOOandGNRC)

Residuals:
     Min       1Q   Median       3Q      Max 
-0.46400 -0.09209  0.00221  0.10001  0.28690 

Coefficients:
                   Estimate Std. Error t value Pr(>|t|)   
(Intercept)         0.01733    0.02170   0.798  0.42915   
VOO_Monthly_Return  1.19915    0.37646   3.185  0.00273 **
---
Signif. codes:  0 ‘***’ 0.001 ‘**’ 0.01 ‘*’ 0.05 ‘.’ 0.1 ‘ ’ 1

Residual standard error: 0.1415 on 42 degrees of freedom
Multiple R-squared:  0.1946, Adjusted R-squared:  0.1754 
F-statistic: 10.15 on 1 and 42 DF,  p-value: 0.002726

The slope of the line is the beta for the stock. In this linear regression model, the co-efficient of VOO_MonthlyReturn (1.19915) is the beta for Generac Holdings. 

The monthly return statistics for Generac holdings show that the stock has a very high standard deviation of 15% in its monthly returns (Exhibit 4).

Exhibit 4: Generac Holdings Monthly Return Statistics [June 2019 - January 2023]    
Source: Data Provided by IEX Cloud, Author Calculations Using Microsoft Excel

Here are the return statistics for the Vanguard S&P 500 Index ETF during the same period (Exhibit 5).

Exhibit 5: Vanguard S&P 500 Index ETF Monthly Return Statistics  [June 2019 - January 2023]  

Source: Data Provided by IEX Cloud, Author Calculations Using Microsoft Excel

The Vanguard S&P 500 Index ETF and Generac Holdings' monthly returns had a high positive correlation of 0.72 between October 2021 and September 2022 (Exhibit 6).   

Exhibit 6: Monthly Return Correlation of the Vanguard S&P 500 Index ETF and Generac Holdings
Source: Data Provided by IEX Cloud, Author Calculations Using Microsoft Excel and RStudio


Tuesday, December 13, 2022

Eastman Chemical's Monthly Returns Have a High Correlation with the Vanguard S&P 500 Index ETF

Here's the histogram of monthly returns for Eastman Chemical (EMN) between June 2019 and November 2022 (Exhibit 1). Please click on the image to see an enlarged version.  

Exhibit 1:

Eastman Chemical Histogram of Monthly Returns (Source: Data Provided by IEX Cloud, Author Calculations using Microsoft Excel)

  The average monthly returns of Eastman Chemical are slightly better than that of the Vanguard S&P 500 Index ETF (Exhibit 2 & 3). But Eastman Chemical has a much higher (nearly double) standard deviation (volatility) of monthly returns than the Vanguard S&P 500 Index ETF. 
     

Exhibit 2:

Eastman Chemical Average, First Quartile, Third Quartile, and Standard Deviation of Monthly Returns. (Data Provided by IEX Cloud, Author Calculations Using Microsoft Excel)

Exhibit 3:
Vanguard S&P 500 Index ETF Average, First Quartile, Third Quartile, and Standard Deviation of Monthly Returns. (Data Provided by IEX Cloud, Author Calculations Using Microsoft Excel)

Eastman Chemical moves closely with the market since it has a high positive correlation of 0.78.

> cor(VOOandEMN['EMN_Monthly_Return'], VOOandEMN['VOO_Monthly_Return'], method = c("pearson", "kendall", "spearman"))

                      VOO_Monthly_Return

EMN_Monthly_Return          0.7898654

A linear regression model of the monthly returns of Vanguard S&P 500 Index ETF as the independent variable and Eastman Chemical as the dependent variable yields a beta of 1.54.  

> # Conduct the Linear Regression of the Monthly Returns Between $VOO and $EMN

> lmVOOEMN = lm(EMN_Monthly_Return~VOO_Monthly_Return, data = VOOandEMN)

> # Present the summary of the results from the linear regression

> summary(lmVOOEMN)


Call:

lm(formula = EMN_Monthly_Return ~ VOO_Monthly_Return, data = VOOandEMN)


Residuals:

     Min       1Q   Median       3Q      Max 

-0.12433 -0.04969 -0.01148  0.05611  0.13701 


Coefficients:

                    Estimate Std. Error t value  Pr(>|t|)    

(Intercept)        -0.003992  0.010914   -0.366  0.716    

VOO_Monthly_Return  1.548548  0.190108    8.146  5.02e-10 ***

---

Signif. codes:  0 ‘***’ 0.001 ‘**’ 0.01 ‘*’ 0.05 ‘.’ 0.1 ‘ ’ 1


Residual standard error: 0.06942 on 40 degrees of freedom

Multiple R-squared:  0.6239, Adjusted R-squared:  0.6145 

F-statistic: 66.35 on 1 and 40 DF,  p-value: 5.023e-10

The coefficient of VOO_Monthly_Return (slope of the regression line) is the stock's beta. This beta value means that for every 1% change in the monthly returns of the Vanguard S&P 500 Index ETF, Eastman Chemical, on average, changes by 1.54% (monthly). This relationship between the two companies is significant at the 95% confidence interval, given the p-value of 5.02e-10.

This close positive relationship between the two explains why Eastman Chemical has lost 25.6%, while the Vanguard S&P 500 Index ETF (VOO) has lost 14.5%.    


Saturday, December 10, 2022

Monthly Return Analysis of Conagra Brands

Conagra Brands owns many iconic brands in the food business (Exhibit 1). The company is categorized as a consumer staple. 

Exhibit 1:


Here's the histogram of monthly returns of Conagra Brands between June 2019 and November 2022 (Exhibit 2). Please click on the image to see an enlarged version.  

Exhibit 2:

Conagra Brands Histogram of Monthly Returns (Source: Data Provided by IEX Cloud, Author Calculations using Excel)

The average monthly returns of Conagra Brands (Exhibit 3) are very similar to that of the Vanguard S&P 500 Index ETF (Exhibit 4).

Exhibit 3: 

(Source: Data Provided by IEX Cloud, Data Calculations Using Excel)

Exhibit 4:

(Source: Data Provided by IEX Cloud, Data Calculations Using Excel)

The monthly returns of Conagra Brands and the Vanguard S&P 500 Index ETF have a mild positive correlation of 0.27 (Exhibit 5)

Exhibit 5:  


A 12-month rolling correlation of the monthly returns yielded a very high positive correlation of 0.8 between April 2020 and March 2021 (Exhibit 6).

Exhibit 6:

(Source: Data Provided by IEX Cloud, Correlation Calculations Using RStudio)

A 12-month rolling correlation of the monthly returns yielded the highest negative correlation of 0.37 between July 2021 and June 2022 (Exhibit 7).

Exhibit 7:

(Source: Data Provided by IEX Cloud, Correlation Calculations Using RStudio)

A linear regression model estimates Conagra's Beta at 0.34, which is not statistically significant at the 95% confidence interval. The p-value is 0.083, suggesting that the correlation is not statistically significant.

Here's the output of the linear model:

Call:
lm(formula = CAG_Monthly_Return ~ VOO_Monthly_Return, data = VOOandCAG)

Residuals:
      Min        1Q    Median        3Q       Max 
-0.168638  -0.044057  -0.004737   0.045175  0.170379 

Coefficients:
                   Estimate Std. Error t value Pr(>|t|)  
(Intercept)        0.007141   0.011079   0.645   0.5229  
VOO_Monthly_Return 0.342593   0.192981   1.775   0.0835 .
---
Signif. codes:  0 ‘***’ 0.001 ‘**’ 0.01 ‘*’ 0.05 ‘.’ 0.1 ‘ ’ 1

Residual standard error: 0.07047 on 40 degrees of freedom
Multiple R-squared:  0.07303, Adjusted R-squared:  0.04986 
F-statistic: 3.152 on 1 and 40 DF,  p-value: 0.08346

The adjusted R-squared is 0.049, meaning that just 4.9% of Conagra's monthly returns can be explained by the monthly returns of the Vanguard S&P 500 Index ETF.    


Sunday, December 4, 2022

Mothly Return Volatility (Beta) of Reynolds Consumer Products

Reynolds Consumer Products (REYN) makes many iconic household products, such as Reynolds Wrap, Hefty waste bags, and FreshLock zipper bags [Exhibit 1]

Exhibit 1: Some of the Products Made by Reynolds Consumer Products Co.

Reynolds Consumer Products Source: Reynolds brands 

 I analyzed the monthly return of Reynolds (REYN) between February 2020 and November 2022. Here's the histogram of the monthly returns (click on the image to see an enlarged version) [Exhibit 2]:

Exhibit 2

Source: Data Provided by IEX Cloud, Author Calculations and Graphs Using Microsoft Excel 

Here's the graph of the monthly returns of the Vanguard S&P 500 Index ETF (VOO) on the x-axis and Reynold's monthly returns on the y-axis [Exhibit 3]:

Exhibit 3

Source: Data Provided by IEX Cloud, Graph Created using RStudio

The Pearson correlation of the monthly returns is a positive 0.46. This correlation value can be considered to have medium strength. This correlation is statistically significant at the 95% confidence interval with a p-value of 0.0057.  

A linear regression of the monthly returns of Reynolds and the Vanguard S&P 500 Index ETF yields a beta value of 0.44. This beta value means that for every 1% change in the value of the Vanguard ETF, on average, Reynolds' stock will change by 0.44%. Yahoo Finance also shows a beta of 0.44 [Exhibit 4]

Exhibit 4

Source: Yahoo Finance

The adjusted R-squared value provided by the linear regression is 0.19. This adjusted R-squared value indicates that about 19% of Reynold's monthly returns are explained by the monthly returns of the Vanguard S&P 500 Index ETF.  

Here's the output from the linear regression model constructed using RStudio:

Call:

lm(formula = REYN_Monthly_Return ~ VOO_Monthly_Return, data = VOOandREYN_MonthlyReturns)

Residuals:

      Min        1Q    Median        3Q       Max 

-0.092919 -0.037524 -0.003499  0.037494  0.137349 

Coefficients:

                   Estimate Std. Error t value Pr(>|t|)   

(Intercept)        0.001072   0.009234   0.116  0.90828   

VOO_Monthly_Return 0.440311   0.148653   2.962  0.00572 **

---

Signif. codes:  0 ‘***’ 0.001 ‘**’ 0.01 ‘*’ 0.05 ‘.’ 0.1 ‘ ’ 1

Residual standard error: 0.05329 on 32 degrees of freedom

Multiple R-squared:  0.2152, Adjusted R-squared:  0.1907 

F-statistic: 8.773 on 1 and 32 DF,  p-value: 0.005722

The p-value is significant at a 95% confidence interval with a value of 0.005722. 

Here's the residuals plot for the linear regression between Reynolds Consumer Products and the Vanguard S&P 500 Index ETF [Exhibit 5]:

Exhibit 5

Residuals Plot for Linear Regression of the monthly returns of the Vanguard S&P 500 Index as the independent variable and Reynold Consumer Products (Source: Data Provided by IEX Cloud, Graph Created using RStudio)

  Here are the average, first quartile, third quartile, and standard deviation of Reynold's monthly returns [Exhibit 6]:

Exhibit 6


Here are the average, first quartile, third quartile, and standard deviation of the Vanguard S&P 500 Index ETF [Exhibit 7]:

Exhibit 7


Saturday, November 26, 2022

Beta of Cummins Included in the List

 Here's the latest list of beta values. I have included Cummins on this list, and the returns for Cummins and the Vanguard S&P 500 Index are based on November 25, 2022, closing prices. Click on the image to see an enlarged version. 

Exhibit: Beta Values for Cummins Included in the list


Companies in this list:

  • Cisco Systems
  • Colgate-Palmolive
  • Lennox International
  • Sealed Air
  • Boeing
  • Newell Brands
  • Timken
  • Cummins


Monthly Return Comparison Between Cummins and Vanguard S&P 500 Index ETF

The following chart shows the Vanguard S&P 500 Index ETF (VOO) monthly returns on the x-axis and Cummins (CMI) on the y-axis. The regression line on the graph shows a steep slope, and the Pearson correlation value is 0.7. This value shows a very strong correlation between the monthly returns of the Vanguard S&P 500 Index ETF and Cummins. The p-value is significant at a 95% confidence interval. Cummins has returned 13.9% in the past year, while the Vanguard S&P 500 Index ETF has returned a -12.4%.  

Exhibit: Monthly Returns of Vanguard S&P 500 Index ETF and Cummins [June 2019 - October 2022]


The following command was used to create this graph:

> # Create a new Graph of $VOO and $CMI Monthly Returns as Percentages
> ggscatter(df1, x = 'VOO_Monthly_Return', y = 'CMI_Monthly_Return', 
+           add = "reg.line", conf.int = TRUE, 
+           cor.coef = TRUE, cor.method = "pearson",
+           xlab = "VOO ETF Monthly Returns (%)", ylab = "CMI Monthly +           Returns (%)")

A linear regression of the monthly returns of the Vanguard S&P 500 Index ETF and Cummins shows the beta (coefficient of Vanguard S&P 500 Index ETF) for Cummins' monthly returns compared to the Vanguard ETF. 

# Conduct the Linear Regression of the Monthly Returns Between $VOO and $CMI
lmVOOCMI = lm(CMI_Monthly_Return~VOO_Monthly_Return, data = VOOandCMI)
# Present the summary of the results from the linear regression
summary(lmVOOCMI)

Call:
lm(formula = CMI_Monthly_Return ~ VOO_Monthly_Return, data = VOOandCMI)

Residuals:
      Min        1Q    Median        3Q       Max 
-0.123268 -0.051037  0.004537  0.047062  0.115727 

Coefficients:
                   Estimate Std. Error t value Pr(>|t|)    
(Intercept)        0.005104   0.009226   0.553    0.583    
VOO_Monthly_Return 0.993327   0.160541   6.187 2.84e-07 ***
---
Signif. codes:  0 ‘***’ 0.001 ‘**’ 0.01 ‘*’ 0.05 ‘.’ 0.1 ‘ ’ 1

Residual standard error: 0.05819 on 39 degrees of freedom
Multiple R-squared:  0.4954, Adjusted R-squared:  0.4824 
F-statistic: 38.28 on 1 and 39 DF,  p-value: 2.845e-07

Cummins has a beta of 0.99 (nearly 1). Given this beta, Cummins, on average, moves in line with the S&P 500 Index. The adjusted R-squared value of 0.48 shows that about 48% of Cummins' monthly returns can be attributed to the returns of the S&P 500 Index. The p-value of 2.84e-07 shows that the regression analysis results are significant at the 95% confidence interval.

The average monthly return for Cummins between June 2019 and October 2022 was 1.49%. A one-sample t-test shows that the monthly return falls between -1.05% and 4.04%. But, the p-value of 0.99 is much higher than 0.05. This t-test may not be significant in the 95% confidence interval.        

#
# One Sample t-test of $CMI average monthly returns.
# Step 1: 
# Copy Dataframe Column CMI_Monthly_Return into a List 
#
CMI_Monthly_Return_Col <- c(VOOandCMI['CMI_Monthly_Return'])
# CMI_Monthly_Return_Col is a list object, but needs to be numeric
# for qqnorm to work.  
#
typeof(CMI_Monthly_Return_Col)
# Convert List Object into a Column of doubles as as.numeric and unlist
#
y_CMI_Monthly_Return_Col <- as.numeric(unlist(CMI_Monthly_Return_Col))
typeof(y_CMI_Monthly_Return_Col)
# Let’s check if the data comes from a normal distribution 
# using a normal quantile-quantile plot.
# Source: https://cran.r-project.org/web/packages/distributions3/vignettes/one-sample-t-test.html

Exhibit: Check if Cummins' Monthly Returns are Normally Distributed before doing a t-test


#
qqnorm(y_CMI_Monthly_Return_Col)
qqline(y_CMI_Monthly_Return_Col)
# Conduct a t-test to see if the population mean is 1.49% [0.0149]
#
t.test(y_CMI_Monthly_Return_Col, mu = .0149)

One Sample t-test

data:  y_CMI_Monthly_Return_Col
t = 0.0045069, df = 40, p-value = 0.9964
alternative hypothesis: true mean is not equal to 0.0149
95 percent confidence interval:
 -0.01057188  0.04048574
sample estimates:
 mean of x 
0.01495693 


Tuesday, November 22, 2022

Volatility of Monthly Returns of Newell Brands Compared to the Vanguard S&P 500 Index ETF

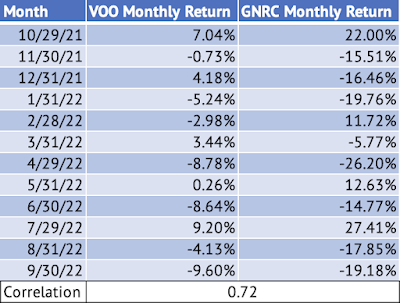
The monthly returns of Newell Brands and the Vanguard S&P 500 ETF have a positive correlation of 0.44, as calculated using the Pearson method. The data used in this study is range from June 2019 to October 2022 (41 months of data). 

Newell Brands is a company that owns some very famous brands across multiple consumer and commercial product lines. 

Exhibit: The Brands Owned by Newell Brands

(Source: Newell Brands)


Here's the R command and the output from R-Studio

> # Calculate the Monthly Return Correlation between Newell Brands 

> # and Vanguard S&P 500 Index using the Pearson method 

> cor(VOOandNWL['NWL_Monthly_Return'], VOOandNWL['VOO_Monthly_Return'], method = c("person"))

                        VOO_Monthly_Return

NWL_Monthly_Return          0.4434957 

Here's the plot of the S&P 500 and the Newell Brands' monthly returns:

Exhibit: S&P 500 Index Monthly Returns VS. Newell Brands Monthly Returns

                       S&P 500 Index Monthly Returns against Newell Brands' Returns
                          (Source: Data Provided by IEX Cloud, Correlation and Graph on RStudio)

When the correlation is calculated for the months when the S&P 500 Index had positive returns, the correlation drops to 0.28. 

> # Calculate the Monthly Return Correlation between Newell Brands 

> # and Vanguard S&P 500 Index using the Pearson method

> # for only those months when the Vanguard S&P 500 Index ETF 

> # had positive returns.

> cor(VOOandNWLPositiveReturns['NWL_Monthly_Return'], VOOandNWLPositiveReturns['VOO_Monthly_Return'], method = c("person"))

                        VOO_Monthly_Return

NWL_Monthly_Return           0.284022

Here's the plot of the S&P 500 Index against Newell Brands' monthly returns for months when the S&P 500 index had a positive return. 

           Exhibit: S&P 500 Index Monthly Positive Returns VS. Newell Brands Monthly Returns

S&P 500 Index Monthly Returns (Positive Months) against Newell Brands' Returns
                          (Source: Data Provided by IEX Cloud, Correlation and Graph on RStudio)

The linear regression of the monthly returns of the S&P 500 index and Newell Brands is used to estimate the average change in the monthly return of Newell Brands for a 1% change in the S&P 500 index. The coefficient of the independent variable (VOO_Monthly_Return) is the beta of Newell Brands.  In this case Newell Brands has a beta of 0.79. For every 1% monthly change in the S&P 500 index, Newell Brands is estimated to change by 0.79%. Yahoo Finance has calculated a beta of 0.84 for Newell Brands.      

> # Conduct the Linear Regression of the Monthly Returns Between $VOO and $NWL

> lmVOONWL = lm(NWL_Monthly_Return~VOO_Monthly_Return, data = VOOandNWL)

> # Present the summary of the results from the linear regression

> summary(lmVOONWL)

Call:

lm(formula = NWL_Monthly_Return ~ VOO_Monthly_Return, data = VOOandNWL)
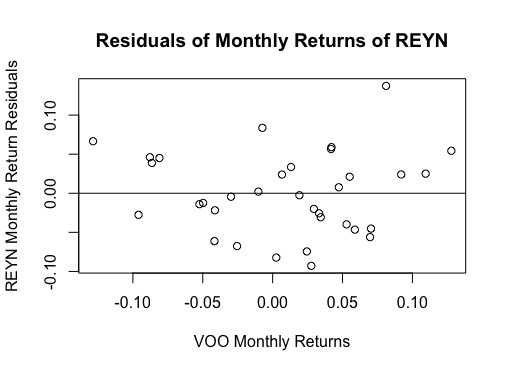
Residuals:

     Min       1Q     Median       3Q      Max 

  -0.14372  -0.06818 -0.01767    0.06086  0.19915 

Coefficients:

                      Estimate   Std. Error   t value  Pr(>|t|)   

(Intercept)          -0.001988   0.014756     -0.135   0.89352   

VOO_Monthly_Return    0.793454   0.256769      3.090   0.00368 **

---

Signif. codes:  0 ‘***’ 0.001 ‘**’ 0.01 ‘*’ 0.05 ‘.’ 0.1 ‘ ’ 1

Residual standard error: 0.09306 on 39 degrees of freedom

Multiple R-squared:  0.1967, Adjusted R-squared:  0.1761 

F-statistic: 9.549 on 1 and 39 DF,  p-value: 0.003681


Saturday, October 1, 2022

Volatility of Monthly Returns of Timken Compared to the Vanguard S&P 500 Index ETF

Here is the graph of monthly returns between June 2019 and September 2022 of Timken (TKR) plotted against Vanguard S&P 500 Index ETF (VOO):

Exhibit: Monthly Returns of VOO and TKR between June 2019 and September 2022

Monthly Returns of VOO and TKR between June 2019 and September 2022
(Source: Data Provided by IEX Cloud, Monthly Returns Calculated in Microsoft Excel, Graph Plotted in R Studio using ggplot package)
Click on the image to enlarge it.

The monthly returns of Timken have a very strong positive correlation of 0.77 with the S&P 500 Index. The very low p-value (p = 6.2e-09) indicates that the monthly returns of the S&P 500 Index have an effect on Timken's monthly returns.  

The Beta value indicates the monthly return volatility of Timken compared to the S&P 500 Index. Yahoo Finance provides a Beta value of 1.59 based on monthly returns over the past five years. A linear regression of the monthly returns between June 2019 and September 2022 yields a Beta of 1.48. The coefficient of Vanguard's monthly return is the volatility of Timken. The coefficient is the linear regression line's slope and Timken's Beta value. In other words, as the monthly return of the Vanguard S&P 500 Index ETF changes by 1%, Timken's monthly return can change by an average of 1.48%.  

Timken's Beta value is one of the highest I have seen. Here are the Beta values of some of the stocks in another post on this blog.  

Here's the output of the linear regression between the monthly returns of Vanguard S&P 500 Index ETF and Timken:

Call:

lm(formula = TKR_Monthly_Return ~ VOO_Monthly_Return, data = VOOandTKR)

Residuals:

      Min        1Q    Median        3Q       Max 

-0.132602 -0.047815 -0.000585  0.059694  0.137770 

Coefficients:

                   Estimate Std. Error t value Pr(>|t|)    

(Intercept)        0.001198   0.011348   0.106    0.916    

VOO_Monthly_Return 1.489061   0.199966   7.447 6.17e-09 ***

---

Signif. codes:  0 ‘***’ 0.001 ‘**’ 0.01 ‘*’ 0.05 ‘.’ 0.1 ‘ ’ 1

Residual standard error: 0.07103 on 38 degrees of freedom

Multiple R-squared:  0.5934, Adjusted R-squared:  0.5827 

F-statistic: 55.45 on 1 and 38 DF,  p-value: 6.168e-09  


Tuesday, September 27, 2022

Boeing's Monthly Return Volatility Compared to the Vanguard S&P 500 Index ETF From June 2019 to August 2022

 Given its dominant position in the aerospace market, one would think Boeing's (BA) monthly returns would be less volatile than the S&P 500 index (VOO). But, Boeing has endured a lot in the past few years. First came the trade war with China that froze Boeing out of the second-largest aerospace market in the world.  Then came the COVID-19 pandemic that grounded airlines worldwide and brought Boeing to its knees. We did not even talk about the 737 Max plane crash in Ethiopia that kicked off the disastrous few years for Boeing.  

Boeing has never fully recovered from either the trade war or the pandemic. Boeing remains frozen out of the Chinese market, and airlines are only now seeing air travel return close to pre-pandemic levels (Exhibit 1).

Exhibit 1: TSA Checkpoint Travel Number September 17, 2022 - September 26, 2022

TSA Checkpoint Travel Number September 17, 2022 - September 26, 2022
TSA Checkpoint Travel Numbers (Source: TSA.GOV)


Now, the world is grappling with slowing growth due to high inflation and interest rates, which is putting further pressure on Boeing. By the looks of it, Boeing stock may take a decade or more to recover its losses if it ever recovers. Boeing's stock has dropped from $440 in March 2019 to $127 as of September 27 - a loss of 71%.  
Due to these massive crises, Boeing's stock returns have become unhinged from that of the S&P 500 index. A linear regression of the monthly returns of the Vanguard S&P 500 Index and Boeing yields a very high beta of 1.35 (slope of the regression line). The value of 1.35 is the coefficient of the monthly returns of the Vanguard S&P 500 Index ETF (VOO).  Yahoo Finance displays a beta of 1.36 based on 5-year monthly returns.  One can expect any change in the Vanguard ETF to be magnified by Boeing.  For every 1% change in monthly returns of the S&P 500 index, Boeing's monthly returns are expected to change by 1.35%. Also, just 25% (Adjusted R-Squared in the RStudio output below) of Boeing's returns are explained by the monthly returns of the S&P 500 Index.  

Exhibit: Vanguard S&P 500 Index ETF and Boeing Monthly Returns [June 2019 - August 2022]

Vanguard S&P 500 Index ETF and Boeing Monthly Returns [June 2019 - August 2022]
(Source: Data Provided by IEX Cloud, Author Calculations Using RStudio)

Here's the output from the linear regression conducted on RStudio: 

> lmBAVOO = lm(BA_Monthly_Return~VOO_Monthly_Return, data = VOOandBA)

> summary(lmBAVOO)

Call:

lm(formula = BA_Monthly_Return ~ VOO_Monthly_Return, data = VOOandBA)


Residuals:

     Min       1Q   Median       3Q      Max 

-0.26036 -0.07433 -0.00562  0.07323  0.33452 


Coefficients:

                   Estimate Std. Error t value Pr(>|t|)    

(Intercept)        -0.02348    0.02007  -1.169 0.249682    

VOO_Monthly_Return  1.35442    0.36247   3.737 0.000628 ***

---

Signif. codes:  0 ‘***’ 0.001 ‘**’ 0.01 ‘*’ 0.05 ‘.’ 0.1 ‘ ’ 1


Residual standard error: 0.1229 on 37 degrees of freedom

Multiple R-squared:  0.274, Adjusted R-squared:  0.2543 

F-statistic: 13.96 on 1 and 37 DF,  p-value: 0.0006279


Paccar: Peak Demand For Trucks

 Paccar ( PCAR ) produced 185,900 trucks in 2022 and is on track for another record year in 2023. The company has experienced good revenue ...