Showing posts with label Economy. Show all posts

Tuesday, October 10, 2023

Paccar: Peak Demand For Trucks

 Paccar (PCAR) produced 185,900 trucks in 2022 and is on track for another record year in 2023. The company has experienced good revenue growth in 2021 and 2022. The company has experienced stellar gross and operating margins over the past few years. The company registered a 16% gross and 13% operating margin in 2022. The current fiscal year, 2023, may bring even more good news on the margin front. The company registered a 20% gross and 17% operating margin in its March 2023 quarter and maintained its 17% operating margin in June 2023. 

Unfortunately, the demand for trucks may have peaked, given high-interest rates, high inflation, and waning consumer demand. Some of the strength in the truck market was due to the stimulus and subsidies provided by the U.S. Federal Government that bolstered infrastructure spending and brought about a manufacturing renaissance in this country. Although the bills passed by Congress in 2022 have more spending left for a few more years, the weakening consumer and lack of demand in the real estate sector may counteract the spending by the Federal Government. Fiscal year 2023 may be as good as it gets for Paccar. The stock has performed well over the past year, and its dividend yield has fallen. Dividend income seekers may have to wait for a much higher dividend before buying the stock. Treasury rates have increased enough that bonds offer an attractive alternative for investors waiting for a higher yield. Due to these reasons, I rate it a hold.

Exceptional performance of Paccar.

Paccar has performed exceptionally well over the past year, gaining 50% (Exhibit 1). The stock has handily outperformed the S&P 500, which has returned 15% over the past year. Cummins (CMI) gained just 3% over the past year. Year-to-date, the stock has gained 33% compared to the 12% return of the S&P 500 Index (SP500). The Vanguard Industrials Index Fund ETF (VIS) has had a great year, with a return of 16% over the past year. The industrial sector has benefitted from the stimulus and subsidy spending by the U.S. Federal Government. Although more subsidy spending is left in the coming years under the bill authorized by Congress in 2022, a combination of high interest rates and a slowing global economy may cap any upside in this stock.

Exhibit 1: 

Performance of Paccar, S&P 500, and Cummins

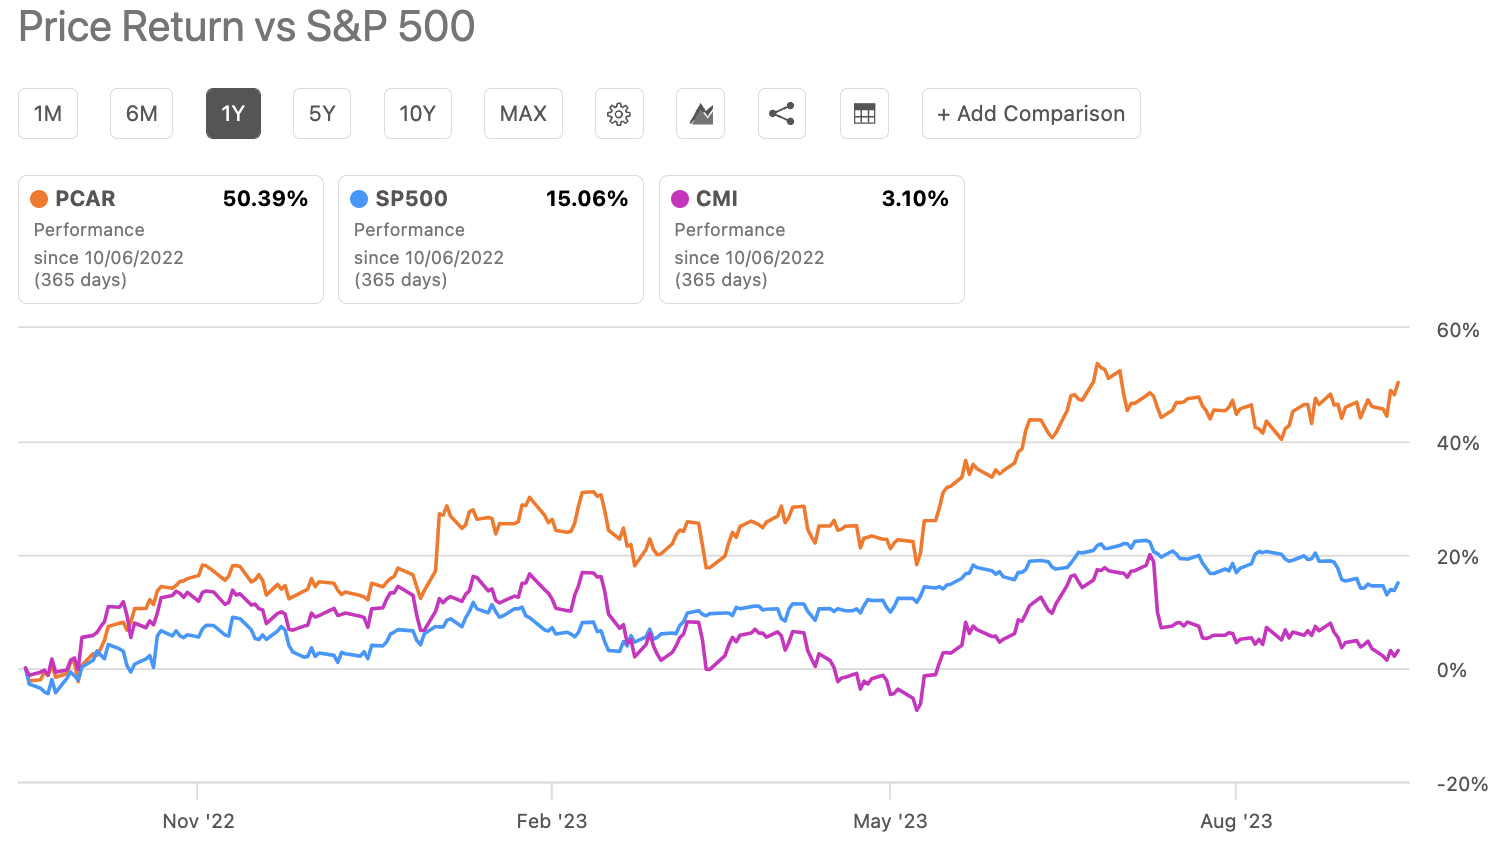
Performance of Paccar, S&P 500, and Cummins (Seeking Alpha)

Fully valued

Although the stock, trading at a forward GAAP PE of 11.4x, looks undervalued compared to its five-year average of 14.4x, given the economic environment and the rate increase, this lower valuation may be deserved. The Vanguard Industrial Index ETF (VIS) may be overvalued, trading at a weighted average PE of 20x and a price/book ratio of 4x. The EV/EBITDA multiple may better assess the company’s valuation. The stock trades at a 10.2x forward EV/EBITDA multiple compared to the sector median of 10.7x. This indicates the stock may be fully valued. Cummins (CMI), a Paccar peer, looks undervalued, trading at a 7.8x forward EV/EBITDA multiple.

Dividends, buybacks, and debt.

Given the stock's performance over the past year, the yield has dropped to 1.2%. The Vanguard Industrials ETF offers a yield of 1.4%, and the Vanguard S&P 500 Index ETF yields 1.58%. The payout ratio is 12%, a rather conservative number. But, given the cyclical nature of the truck business, Paccar may be suitable to be cautious with its payout. A low payout may also free up cash for stock repurchases. The company paid $483 million in total dividend payments over the trailing twelve months. The company has grown its dividend annually at the pace of 7.5%, compared to 6.8% for the sector, over the past five years.

Paccar has spent $828 million in share buybacks over the past decade. But, the company has issued over $300 million in stock over the past decade, blunting the share buybacks' effects. The diluted share count is reduced from 532.8 million in 2013 to 524.1 million over the trailing twelve months, just 8.7 million. Using this share count reduction, the average price paid for the buybacks is $95 compared to its current price of $86.

The company generated $5.4 billion in EBITDA during the trailing twelve months. Paccar generated $3.5 billion in operating cash and $2.37 billion in free cash flow. This free cash flow number is derived by deducting the company’s capital expenditures from its operating cash. These numbers are good, but investors should remember that 2022 was one of the strongest years for truck demand globally, and 2023 is shaping to be another good year. I am concerned these good times, and any demand reduction could dent its cash flows. Also, the company generates a lot of revenue from its financing division. If the economy slows further and demand wanes, it could increase bad loans and decrease the demand for new loans, as the U.S. Treasury rates have increased to their highest levels in over a decade.

Paccar has performed exceptionally well over the past decade, returning 237% on a total return basis compared to the 210% return of the S&P 500 Index. But, weakening consumers coupled with high rates may put a substantial dent in demand across the various sectors of the economy. The stock’s performance has been impressive, and the industrial sector has been strong over the past year. Most of this strength may be attributed to the various bills passed by the U.S. Congress that have billions of dollars in outlays for renewable energy, electric vehicles, infrastructure modernization, and efforts to re-shore manufacturing and build semiconductor plants. Investors should be concerned that most of the demand across the industrial sector and Paccar is driven not by consumer organic demand but by the government's industrial policy. Paccar’s strength may not last, and it may be best for investors to wait for a much lower entry point.

Monday, December 27, 2021

Comparing Inflation Using Producer Price Index (PPI)

The Bureau of Labor Statistics does a world-class job of compiling the producer price index (PPI) across multiple industries and product groups. I wanted to better understand inflation from one category - Fruit and Vegetable Canning. 

We know 2020 was a year like no other in world history. Demand slumped initially when the pandemic shut down the economy. But, the stimulus that was unleashed in the U.S. and across the world helped stimulate demand for products. The work-from-home trend added to the need for furniture and laptops. Comparing the producer price index between 2020 and 2021 may not accurately picture inflation. So, I have compared the change in the index between 2019 and 2021 for the fruit and vegetable canning industry. That shows a sharp increase in inflation (See Exhibit: Increase in Producer Price Index Between 2019 and 2021). The graph also shows the trend line and the equation. The slope for the change in PPI between 2019 and 2021 is 0.0037. The data used is for January to November for each year.   

Exhibit: Increase in Producer Price Index Between 2019 and 2021 (%)   

(Source: BLS, Author Calculations)

We compare this producer price index year-over-year change with change in PPI for the fruit and vegetable canning industry between 2007 and 2009 (See Exhibit: Increase in Producer Price Index Between 2007 and 2009 (%)). The year 2009 was when the world was coming out of the deep recession caused by the U.S. subprime mortgage crisis. Inflation for the fruit and vegetable canning category saw a year-over-year increase of 14% between 2007 and 2009. The slope was -0.0021 showing that the inflationary pressure tailed off by the end of the year in 2009. In 2021, the price index is still increasing.   

Exhibit: Increase in Producer Price Index Between 2007 and 2009 (%)  
(Source: BLS, Author Calculations)

In the first half of 2022, the stimulus-driven demand should be fading. That should lead to moderation in the growth of the producer price index.  


Wednesday, August 5, 2020

Disastrous Earnings at Dow Jones Industrial Average for the Latest Quarter

As of June 30, 2020, most of the companies in the Dow Jones Industrial Average (DJIA) have already reported quarterly earnings . The pandemic induced recession and the oil price war waged by Saudi Arabia and Russia have ravaged the earnings of the companies in the index. The first quartile EPS growth rate for the DJIA was a negative 68%.  The third quartile EPS growth was just 5%.

Exhibit: Latest Quarter EPS Growth Rate for Companies in the DJIA
(Source: SECURFII)
    
Exhibit: Gains from 52-Week Low for Companies in the DJIA
(Source: SECURFII)

Given this earnings back drop the stocks have done remarkably well. The first quartile gain for stocks in the DJIA from their 52-week low was 35%. The third quartile gain was 62%.
Exxon Mobil had the biggest drop in EPS going from $0.53 in the previous quarter to a negative $0.7 in the latest quarter that ended June 2020. 
In fact 20 out of their 30 companies in the DJIA recorded negative EPS growth rates.
 
Exhibit: Earnings of some of the companies in the DJIA
(Source: SECURFII)
 
(Disclosure: I own XOM, CVX, DOW, and others in the DJIA) 

Ford's New CEO Faces a Tough Road Ahead

On August 4, 2020 Ford (NYSE: F) announced that they are replacing Jim Hackett - the current CEO - with Jim Farley.  Farley was serving as the Chief Operating Officer at the company. Ford is getting ready to launch the new model for its iconic F-150. The F-150 is the best selling vehicle in the U.S. 

Exhibit: Ford is Launching a New Model of its Most Important Vehicle - The Ford F-150
(Source: SeekingAlpha)

Ford is also reviving its iconic Bronco brand in 2021. The new Bronco, I must admit looks absolutely stunning. 
Exhibit: The New Ford Bronco Line-up
(Source: Ford Website)
Ford is also making a huge commitment to electric vehicles. The company will have 15 electrified vehicle models available by end of the year. The competition in the electric vehicle market is heating up substantially with General Motors releasing a whole slew of vehicles and many other auto makers doing the same.

Exhibit: Ford is Launching New Electric Vehicles
(Source: SeekingAlpha)
Even before this pandemic induced economic crisis, Ford was not generating enough cash flow. It had a meager $0.5 billion in adjusted free cash flow in Q4 2019.
The challenge for Ford is that they were late to the electric car market and their upcoming models may not be differentiated enough. For example, their Escape plug-in hybrid model is advertised as having a 490 mile range. That would be a good range for a plug-in hybrid but there are many vehicle with that range. Given the upcoming competition in the the electric vehicle market will a model such as Escape plug-in hybrid stand out. 
They may have to do what Mary Barra at General Motors (GM) did years ago. She exited unprofitable markets such as Europe and India. Ford may have to exit unprofitable markets and bring their manufacturing capacity in-line with their sales and ensure they can stay profitable in a recession such as the one we are in now. 
Ford has a tough road ahead and in the interim the stock is going to continue under-performing.           

(Disclosure: I do not own Ford stock)
 

Tuesday, August 4, 2020

What is wrong with 3M?

I am going to break the suspense and answer the question in the title: "There's nothing wrong with 3M!" Its earnings for the quarter that ended June 2020 was exception given the tough circumstances under which every company in the world has been operating this year. Its GAAP EPS was $2.22 for Q2 2020 against an estimate of $1.80. Its revenue of $7.18 billion missed estimates by just $110 million. Complete industries in this era of the pandemic are in a free-fall and here we are punishing an essential, iconic American company for missing revenue by an amount, which would be 1.5% of the $7.18 billion.

Exhibit: 3M Q2 2020 Sales Declined by 13.1%

(Source: SeekingAlpha)

Yes, there was broad weakness in sales across all their business segments. But the company has been aggressive in reducing costs and was able to improve adjusted EBITDA margin by 110 basis points to 26.5%. Their operating cash flow increased 15% year-over-year to $1.9 billion. The management even paid down debt by $1.7 billion since the March 31, 2020 quarter.
The stock has been punished after the earnings. It has dropped from about $163 and trades a little over $151 as of August 4th. 

Exhibit: 3M Technical Indicators are Flashing a Strong Sell on August 4, 2020.

(Source: Tradingview)

Currently, the technical indicators are all flashing a strong sell signal. The market seems to be giving-up on 3M. But the Bollinger Bands are tightening and this raises the possibility of a sharp price move in either direction. Given that the other technical signals are flashing sell, tightening Bollinger Bands could indicate a drop from this level.

Exhibit: 3M Bollinger Bands are Tightening.

(Source: Tradingview)

(Disclosure: I do not own 3M)


Monday, August 3, 2020

Boeing has broken below a key support level

Boeing missed earnings targets by a huge margin on June 29, 2020. One Wall Street analyst called it a "planewreck"! The company reported a loss of $4.20 when the Wall Street estimate was for a loss of $2.55. This huge miss is driving the stock even lower. I have done a brief technical analysis of Boeing's 3-month chart and it does not paint a pretty picture.  The stock dropped below key support level of around $169. Today's small rally in the stock that brought it to $162 may be a false one and Boeing may continue dropping. 


(Source: TradingView)


(Disclosure: I own Boeing)

Saturday, August 1, 2020

Caterpillar May be Set to Weaken Further.

Caterpillar recently announced that it may face a prolonged sales decline. The stock lost considerable ground on the day of this news. Looking at the Caterpillar's chart, it seems like weakness is set to continue. Caterpillar's sales have declined by 30% in Q2 2020. That's a very substantial decline. Given that the company sells very high-priced capital equipment that last a long time, demand for this equipment may recover slowly.

Exhibit: Caterpillar's Sales Were Down 30% Compared To Q2 2019.


(Source: SeekingAlpha)

I have also done a trend analysis on TradingView that seem to indicate further weakness to come in the stock.  

Exhibit: Caterpillar's chart is reflecting its weak fundamental. 

Morningstar's analyst report on July 31 2020 makes a couple of interesting points:
  • Many end markets served by the company are not directly affected. 
  • Given the rally in gold, that may spur more mining.
All this may not be enough to save the company from a prolonged downturn. 


Tuesday, July 28, 2020

Boeing Lost Support at 50-Day Moving Average In a Bearish Sign For the Stock

Boeing has lost support at the 50-day moving average. This is a bearish sign for the stock.

Exhibit: Boeing's Simple Moving Average (Data based on Monday, July 27, 2020)


(Source: Secure Your Financial Independence - DJIA SMA Report)

Boeing is currently trading at $169.26. There seems to be support at this level. If it loses support here, then Boeing may drop all the way to $120 for the next support level.  Given the bad news at Boeing, it is entirely possible that it will touch $120 in the coming weeks or months. 

Exhibit: Boeing Has Support at $169. If it loses this support, it may drop all the way to $120. 


(Source: SeekingAlpha & Author Annotations)

    Boeing recently announced that it will delay its 777x jet by up to an year. Even before the pandemic, Boeing was dealing with the problems with its 737 Max jets. When the pandemic hit, it grounded the entire travel industry. It now seems like it may take years before the travel industry can fully recover. It may take a couple of years after travel gets back to 2019 level that Boeing will start to get new orders for jets. There's so much excess inventory of jets across the globe that airlines may put off buying new jets for years. Combine this with the problem of airlines going bankrupt and you have lesser number of customers to chase for new jet orders.  Given all these factors, it's entirely plausible that Boeing's stock could give-up much of its gain since May 2020 and retrace to $120. If it loses support at $120, it may test its lows below $100.
    This crisis is a real test of leadership. Boeing is such an iconic company that it's painful to see this downfall. I am confident that in 3-5 years Boeing will be in much better shape.
(Disclosure: I own Boeing)        


Saturday, July 25, 2020

Climate Change Mitigation Technologies Will be Winners in the Future

    For all the efforts that are underway across the globe to keep the earth's temperature from rising, one thing is becoming clearer with each passing day - climate change mitigation technologies and projects will have to be employed at a large scale to tackle its effects. Companies in the climate mitigation space should be on the radar for investors. 
    I have come to this conclusion after reading various articles on the topic of climate change over a number of years. A couple of recent articles in the New York Times only got be thinking more seriously about the kind of climate change mitigation technologies that will be winners in the future. One article discusses the crisis that could be brought on by the mass migration of people due to excessive heat caused by climate change. When excessive heat causes drought, destroys crops, and makes living conditions very hard, people may have no choice than to start migrating towards cities and seek refuge there.
    Various technologies may have to be employed to prevent farmers from dying of hunger and excessive heat. Providing people with air conditioned spaces could be one of the mitigation project that could be more broadly applied. Air conditioner makers such as Carrier (NYSE: CARR) may be a big beneficiaries of this trend. Use of air conditioners increases the global warming and those effects need to be mitigated too.
    To mitigate the effects of drought, more desalination plants will have to be built to supply growing cities with water.  These plants can also be used to supply water for irrigation. Israel is a leader in the use of desalination technology and it's just a matter of time before many other parts of the world - like India, Africa, the United States, and South America - need massive desalination capabilities. These plants are primarily based on seawater reverse osmosis (SWRO) technology. The reverse osmosis plants consume a lot of energy. To reduce energy use, these plants employ energy recovery devices such as the one manufactured by Energy Recovery Inc (NASDAQ: ERII).

Exhibit: A Energy Recovery Device Built by Energy Recovery Inc.


(Source: Energy Recovery Inc.)
   
    Other technologies and projects that will gain wide spread use in the future are vertical or indoor farming and drip irrigation systems. A lot of venture capital investment is going into vertical farming companies. Softbank has invested in an indoor farming start-up called Plenty. While investors focus on high-tech startups like Plenty, they should not lose focus of "old school" technology such as water pumps, drip irrigation systems and water meters that could also see increasing demand in the years to come. Water conservation technologies beyond drip irrigation will gain ground. For example, low-flush toilets could gain wide-spread use in households. Sophisticated leak detection systems could be employed at a much wider scale to prevent water loss in the water distribution networks and at home. 
    As the world tackles climate change, investors should keep a close eye on mitigation technologies that could improve lives.  
(Disclosure: I own shares in Energy Recovery Inc.) 


Tuesday, July 7, 2020

Warren Buffett Bought a Gas Pipeline and an U.S. Judge may have made it a Winning Investment

    Since March, 2020 when the COVID-19 pandemic drove the U.S. and the globe into a recession and tanked markets worldwide, there has been speculation about what Warren Buffet would be buying given the bargains. In March the Dow Jones Industrial Average (DJIA) dropped from an all-time high of 29,551 to 18,591. Many stock watchers and TV pundits speculated that this is the time when Warren Buffett would see value in stocks and put his company's sizeable cash to work.

Exhibit: Dow Jones Industrial Average (DJIA) One-Year Performance


(Source: Google Finance)

    It has now become clear that Warren Buffett and his partner Charlie Munger were looking to strike a few deals at bargain prices, but the intervention by the U.S. Federal Reserve in March made it very easy for companies in all sorts of fiscal shape could easily raise billions of dollars.
    Finally in July 2020 Warren and Charlie did strike a deal. They invested $10 billion in buying the natural gas pipeline assets of Dominion Energy. When almost every investor is shying away from investing in fossil fuel assets, Berkshire Hathaway sees value in it. It's going to take a long time for the world to move away from fossil fuels.
    The past week has produced some stark headlines about the energy business. The Financial Times reported that BP was marking down the value of its oil and natural gas assets by $17.5 billion. Under the shadows of the stress that the oil business is in, Berkshire Hathaway makes a contrarian bet. Then came another headline, this time from a Federal District court. The court ruled that work on the Dakota Access Pipeline will have to stop until a comprehensive environmental review is completed.
    Even before this decision, building anything related to the oil and gas industry in the U.S was an herculean task. This decision makes it harder. It is now assured that the work on this pipeline will not proceed until after the U.S. election. If Joe Biden is elected president then this pipeline may never get built.  So, any oil and gas asset already in existence in the U.S. have just been elevated in value. This deal by Berkshire Hathaway has the potential to offer profitable returns for the company. 

Disclosure: I own shares in Berkshire Hathaway and BP.       


Wednesday, July 1, 2020

How did the U.S. Markets have the Best Quarter in Decades?

    The quarter that ended on Tuesday, June 30th was the best quarter for the market in two decades. How did the U.S. stock market end with such a statistic in the midst of a global pandemic and record unemployment?
    On February 12th, 2020, the Dow Jones Industrial Average (DJIA) had hit an all-time high of 29,551. But by February 21st, 2020, the fear that the COVID-19 virus is going to bring life to a standstill in the U.S was taking hold in the market. The markets were in free-fall from around that time until March 23, 2020. On this date the Dow Jones Industrial Average was at 18,591. It was a drop of about 37% from the top.
                             Exhibit: Dow Jones Industrial Average hit bottom on March 23, 2020
                                            (Source: Google Finance)
    March 23 would end-up being a monumental date for the country as a whole and a one for the history books. This was the date on which the Federal Reserve made an announcement that they are "committed to using its full range of tools to support households, businesses, and the U.S. economy overall in this challenging time."
    This announcement was interpreted by the markets that the U.S. Federal Reserve is going to provide a backstop to the losses mounting across companies of all different sizes. The demand for products and services provided by airlines, restaurants, cruises, and malls vanished overnight. Most of these companies did not have a plan or funds in place for such a dramatic drop-off in demand. The Federal Reserve did not want to see problems in one sector of the economy, mainly in discretionary spending, spillover into other sectors. For example, when fear of COVID-19 took over and many states instituted lock downs or quarantine orders, malls and restaurants were forced to close their doors. That in turn led to these companies not generating any revenues that could be used to pay their bills, such as paying their rent or their suppliers. This cascading effect would lead to companies, cities, and states all across the U.S. laying off millions of people and plunging the U.S. into another great depression
    The Federal Reserve started buying high-quality assets in the open market along with making billions of dollars of loans available to companies of all sizes. Even though millions of people still lost their jobs, an argument could be made that this move by the Federal Reserve did prevent a great catastrophe. Without the bold intervention of the Federal Reserve, a worldwide health crisis could have easily grown exponentially larger when a worldwide economic crisis is unleashed at the same time.
    So, it turns out March 23 was the day the U.S. markets hits bottom. An epic stock market rally started that day and by June 30, 2020, the Dow Jones Industrial Average had gained about 38% from its bottom of 18,591. The DJIA stood at 25,812 on June 30, 2020.             

Paccar: Peak Demand For Trucks

 Paccar ( PCAR ) produced 185,900 trucks in 2022 and is on track for another record year in 2023. The company has experienced good revenue ...