Showing posts with label Consumer Discretionary. Show all posts

Tuesday, January 31, 2023

Why is the stock of Goodyear Tire & Rubber Co. So Volatile?

Goodyear (GT) is a very volatile stock with a beta of 1.86, measured using a linear regression model. This linear regression model used monthly returns for Goodyear and the Vanguard S&P 500 Index ETF (VOO) from June 2019 to January 2023. This beta is one of the highest I have encountered among the stocks I cover (Exhibit 1).

Image: 90% Sustainable Material Demonstration Tire

Source: Goodyear Tire & Rubber Co.


The stock is heavily dependent on the discretionary spending of the consumer. In a downturn, car sales drop, thus affecting Goodyear's sales. The replacement tire sales also drop in an economic slowdown, affecting the company. These might be the reasons behind the high volatility.   

Note: Please click on the image to see an enlarged version.

Exhibit 1: Beta of Stocks in Industrial, Consumer Staples, Technology, and Consumer Discretionary Sectors  

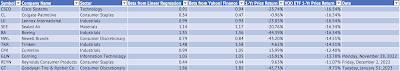
Source: Data Provided by IEX Cloud, Author Calculations using Microsoft Excel & RStudio


Here's the output from the linear regression model:

Call:
lm(formula = GT_Monthly_Return ~ VOO_Monthly_Return, data = VOOandGT)

Residuals:
     Min       1Q   Median       3Q      Max 
-0.21099 -0.10456 -0.01782  0.07052  0.55012 

Coefficients:
                    Estimate Std. Error t value Pr(>|t|)    
(Intercept)        -0.008481   0.021853  -0.388      0.7    
VOO_Monthly_Return  1.869864   0.379106   4.932 1.33e-05 ***
---
Signif. codes:  0 ‘***’ 0.001 ‘**’ 0.01 ‘*’ 0.05 ‘.’ 0.1 ‘ ’ 1

Residual standard error: 0.1425 on 42 degrees of freedom
Multiple R-squared:  0.3668, Adjusted R-squared:  0.3517 
F-statistic: 24.33 on 1 and 42 DF,  p-value: 1.326e-05

The coefficient for "VOO_Monthly_Return" is the beta for the stock.  This coefficient is also the slope of the line.  The monthly returns of Goodyear have been plotted against the returns of the Vanguard S&P 500 Index ETF (Exhibit 2). Exhibit 3 shows the residuals from the linear regression mode. There is a solid positive monthly return correlation of 0.61 between the Vanguard ETF and Goodyear. There is also a significant relationship between the monthly returns of the Vanguard ETF and Goodyear, with a p-value of 1.3e-05.     

Exhibit 2: Monthly Returns Plot of the Vanguard S&P 500 Index ETF and Goodyear Tires

Source: Data Provided by IEX Cloud, Author Calculations Using Microsoft Excel, and Graph Plotted Using RStudio


Exhibit 3: Residuals from the Linear Regression of the Vanguard S&P 500 Index ETF and Goodyear Tires Monthly Returns
Source: Data Provided by IEX Cloud, Author Calculations Using Microsoft Excel, and Graph Plotted Using RStudio


Tuesday, July 21, 2020

Visa, Home Depot, and Nike are a Buy Based on Simple Moving Average

    Home Depot (HD), Visa (V), and Nike (NKE) are buys at these levels when you consider only the 50-Day and 200-Day simple moving averages of all the stocks in the Dow Jones Industrial Average. Nike's 50-day simple moving average (SMA) is greater than its 200-day SMA. That's considered a bullish signal for the stock. Its 10-day SMA is greater than both its 50-day and 200-day. Both Visa and Home Depot exhibit the Golden Cross pattern where the 50-day SMA exceeds the 200-day SMA. But, based on fundamentals are they too expensive? 

Exhibit: Simple Moving Average May be Indicating that Nike is Buy
    

(Source: Securfii)

Exhibit: Simple Moving Average May be Indicating that Home Depot and Visa are a Buy


(Source: Securfii)

Nike is currently trading at 40x forward earnings. Home Depot is trading at 25x forward earnings and Visa is trading at 39x forward earnings. From a fundamental perspective all three companies are trading at a premium. But, on the other hand all three companies are one-of-a-kind in the world. Nike has an incomparable brand that is cherished across the globe. Visa has global network effects that cannot be easily replicated.  Home Depot's biggest strength may be its operational excellence.
Disclosure: I do not currently own HD, V, and NKE.


Thursday, July 2, 2020

Surprise! Bank of America's US 1 List Includes L Brands

The Bank of America's US 1 list is a collection of best investment ideas from the list of buy-rated, US-listed stocks. It came as a surprise to me that L Brands is included in the US 1 list for Q3, 2020.
Victoria's Secret, which is a division of L Brands, has been in trouble for a very long time. Sales at this division have been declining for years. For example, in the fiscal year 2019, Victoria's Secret reported sales of $5.1 billion. This was down from $5.6 billion in the fiscal year 2018. That's a change of about -9% from 2018.

Exhibit: L Brands Net Sales in Fiscal Years 2018 and 2019
(Source: SEC.gov
A similar decline in sales was seen between 2017 and 2018. In 2018, sales declined by 4% compared to 2017.
Exhibit: L Brands Net Sales in Fiscal Years 2017 and 2018
(Source: SEC.gov)
As a result of this decline in sales over multiple years, L Brands had struck a deal with a private equity firm - Sycamore Partners - to take Victoria's Secret private. But, due to the COVID-19 pandemic, Sycamore Partners backed-off from the deal. So, given all those problems with the Victoria's Secret brand, why is Bank of America including L Brands in its influential US 1 list? 
L Brands' inclusion may have more to do with the other division called Bath & Body Works.  
Overall sales did take a huge hit to the downside during the pandemic-driven closure of its stores. But, Bath & Body Works saw an increase of 85% in its direct-to-consumer business. This business recorded $288.9 million in sales in Q1 2020 compared to $156.4 million in Q1 2019. 
Bank of America sees the stock as undervalued given that it may be expecting this outperformance to continue for the Bath & Body Works division and that is why this was a surprise addition to the US 1 list.     
Disclosure: At the time of this publication, I do not own L Brands.     


Paccar: Peak Demand For Trucks

 Paccar ( PCAR ) produced 185,900 trucks in 2022 and is on track for another record year in 2023. The company has experienced good revenue ...