Reynolds Consumer Products (REYN) makes many iconic household products, such as Reynolds Wrap, Hefty waste bags, and FreshLock zipper bags [Exhibit 1].
Exhibit 1: Some of the Products Made by Reynolds Consumer Products Co.
 |
| Reynolds Consumer Products Source: Reynolds brands |
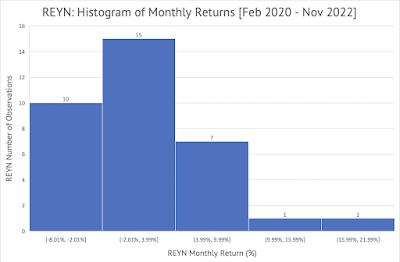
I analyzed the monthly return of Reynolds (REYN) between February 2020 and November 2022. Here's the histogram of the monthly returns (click on the image to see an enlarged version) [Exhibit 2]:
Exhibit 2
 |
| Source: Data Provided by IEX Cloud, Author Calculations and Graphs Using Microsoft Excel |
Here's the graph of the monthly returns of the Vanguard S&P 500 Index ETF (VOO) on the x-axis and Reynold's monthly returns on the y-axis [Exhibit 3]:
Exhibit 3
 |
| Source: Data Provided by IEX Cloud, Graph Created using RStudio |
The Pearson correlation of the monthly returns is a positive 0.46. This correlation value can be considered to have medium strength. This correlation is statistically significant at the 95% confidence interval with a p-value of 0.0057.
A linear regression of the monthly returns of Reynolds and the Vanguard S&P 500 Index ETF yields a beta value of 0.44. This beta value means that for every 1% change in the value of the Vanguard ETF, on average, Reynolds' stock will change by 0.44%. Yahoo Finance also shows a beta of 0.44 [Exhibit 4].
Exhibit 4
The adjusted R-squared value provided by the linear regression is 0.19. This adjusted R-squared value indicates that about 19% of Reynold's monthly returns are explained by the monthly returns of the Vanguard S&P 500 Index ETF.
Here's the output from the linear regression model constructed using RStudio:
Call:
lm(formula = REYN_Monthly_Return ~ VOO_Monthly_Return, data = VOOandREYN_MonthlyReturns)
Residuals:
Min 1Q Median 3Q Max
-0.092919 -0.037524 -0.003499 0.037494 0.137349
Coefficients:
Estimate Std. Error t value Pr(>|t|)
(Intercept) 0.001072 0.009234 0.116 0.90828
VOO_Monthly_Return 0.440311 0.148653 2.962 0.00572 **
---
Signif. codes: 0 ‘***’ 0.001 ‘**’ 0.01 ‘*’ 0.05 ‘.’ 0.1 ‘ ’ 1
Residual standard error: 0.05329 on 32 degrees of freedom
Multiple R-squared: 0.2152, Adjusted R-squared: 0.1907
F-statistic: 8.773 on 1 and 32 DF, p-value: 0.005722
The p-value is significant at a 95% confidence interval with a value of 0.005722.
Here's the residuals plot for the linear regression between Reynolds Consumer Products and the Vanguard S&P 500 Index ETF [Exhibit 5]:
Exhibit 5
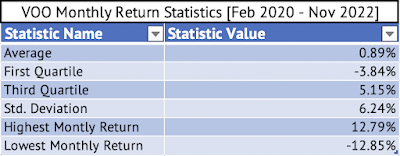
Here are the average, first quartile, third quartile, and standard deviation of Reynold's monthly returns [Exhibit 6]:
Exhibit 6


