Showing posts with label ETF. Show all posts

Saturday, June 17, 2023

The Industrials Sector is on a Tear

 The Vanguard Industrials Index ETF (VIS) touched a 52-week high of $202.86 on Friday, June 16 (Exhibit 1).  

Exhibit 1:

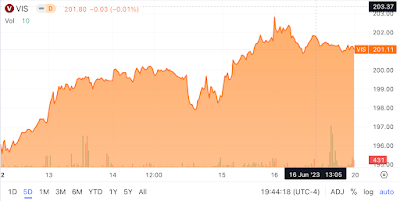
Vanguard Industrial Index ETF (VIS) 5-Day Performance
Source: Seeking Alpha


The top performer in this ETF was Vertiv Holdings, returning 133% over the past year (as of June 16, 2023). The company describes itself as follows:

"Vertiv is a global leader in the design, manufacturing and servicing of critical digital infrastructure for data centers, communication networks, and commercial and industrial environments. Our customers operate in some of the world's most critical and growing industries, including cloud services, financial services, healthcare, transportation, manufacturing, energy, education, government, social media, and retail." (Source: SEC.GOV)

This renewed interest in data centers is not surprising, given the popularity of artificial intelligence (AI) and the investments in new applications powered by AI. 

In the Q1 2023 Earnings call, Vertiv's management said the following about AI:

"We are distinctly seeing the first signs of the AI investment cycle in our pipelines and orders. Vertiv is uniquely positioned to win here, given our market leadership and deep domain expertise in areas like thermal management and controls, which are vital to support the complexity of future AI infrastructures." (Source: Seeking Alpha)

"Let me go back to the investments in AI. You may have heard it as generally characterized as the next infrastructure arms race, Vertiv benefits from this race and is an agnostic partner of choice to the risk participants. The acceleration in investment in AI will turn into a net infrastructure capacity demand acceleration, and this starts to be visible in our pipeline. AI applications’ demand and net capacity increase in the industry, higher power density, a gradual migration to an air and liquid hybrid cooling environment and a transition to liquid-ready facility designed." (Source: Seeking Alpha)

 Here's the list of the top 10 performers in the Vanguard Industrials Index ETF over the past year (Exhibit 2).  

Exhibit 2:

Top 10 Performers in the Vanguard Industrials Index ETF
Source: Barchart.com, Data Provided by IEX Cloud

 
Here's the list of the bottom 10 worst performers in the Industrials ETF over the past year (Exhibit 3):
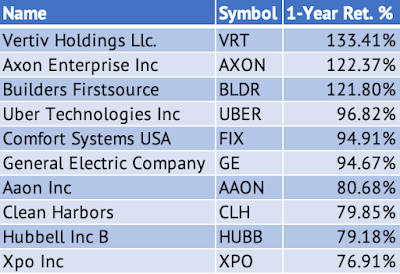
Exhibit 3:

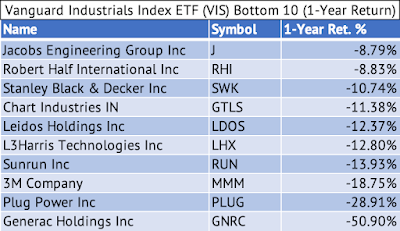
Bottom 10 Worst Performers in the Vanguard Industrials Index ETF
Source: Barchart.com, Data Provided by IEX Cloud


Saturday, February 11, 2023

Hormel Foods' Lower Returns than the Vanguard S&P 500 Index ETF

Hormel Foods own several iconic brands shown in the images below.  


Source: Hormel Foods Corporation

Hormel Foods (HRL) has averaged a lower monthly return than the Vanguard S&P 500 Index ETF (VOO). The company has averaged a monthly return of 46 basis points compared to 105 basis points for the Vanguard S&P 500 Index ETF (Exhibits 1& 2).     

Exhibit 1:

Source: Data Provided by IEX Cloud, Author Calculations using Microsoft Excel

Exhibit 2:
Source: Data Provided by IEX Cloud, Author Calculations using Microsoft Excel

A linear regression of the monthly returns of the Vanguard S&P 500 Index ETF and Hormel Foods yields a beta of 0.237.  

Here's the output from the linear regression model created using RStudio:

Call:
lm(formula = HRL_Monthly_Return ~ VOO_Monthly_Return, data = VOOandHRL)

Residuals:
      Min        1Q    Median        3Q       Max 
-0.102639 -0.023972 -0.001719  0.022192  0.166993 

Coefficients:
                   Estimate Std. Error t value Pr(>|t|)
(Intercept)        0.002084   0.008249   0.253    0.802
VOO_Monthly_Return 0.237144   0.143102   1.657    0.105

Residual standard error: 0.0538 on 42 degrees of freedom
Multiple R-squared:  0.06137, Adjusted R-squared:  0.03902 
F-statistic: 2.746 on 1 and 42 DF,  p-value: 0.1049

The p-value of 0.1 indicates that the relationship is insignificant at the 95% confidence interval.

Between June 2019 and January 2023, the monthly returns of the Vanguard S&P 500 Index ETF and Hormel Foods had a positive correlation of 0.24. But between September 2020 and August 2021, the correlation was a negative 0.13 (Exhibit: 3). This was when stocks such as Apple, Microsoft, Amazon, and Tesla went on an epic, once-in-a-lifetime run into the trillion-dollar club in terms of market capitalization. Consumer staples stocks such as Hormel Foods went out of favor during this period, dropping 10.8%. 

Exhibit 3:

Source: Data Provided by IEX Cloud, Author Calculations using Microsoft Excel and RStudio
Hormel Foods may be the perfect stock to own during a bear market. Its low volatility and, at times, negative correlation with the S&P 500 Index means it performs well when the markets perform poorly.  


Saturday, February 4, 2023

Change in Correlation of the Monthly Returns of Generac Holdings and the Vanguard S&P 500 Index ETF

Generac Holdings (GNRC) has a beta of 1.19 based on a linear regression model of the monthly returns of the Vanguard S&P 500 Index ETF (VOO) and Generac Holdings. The company's residential sales slowdown has pushed the stock lower over the past five months. The stock has dropped 55% compared to a 7% drop for the Vanguard S&P 500 Index ETF over the past year. This massive underperformance of the stock has led to a drop in the monthly return correlation of the Vanguard ETF and Generac Holdings.  

     Exhibit 1: A Generac Generator

Source: Generac Holdings Inc.
Here's the graph of the Vanguard S&P 500 Index ETF and Generac Holdings' monthly returns (Exhibit 2).  

Exhibit 2: Monthly Returns of the Vanguard S&P 500 Index ETF and Generac Holdings

Source: Data Provided by IEX Cloud, Author Calculations on Microsoft Excel, Graph Created on RStudio

The graph of the monthly returns also shows a correlation of 0.44 between the two equities.  
Here are the betas of some of the stocks I have covered over the past few months (Exhibit 3)

Note: Click on each image to see an enlarged version. 
 
Exhibit 3: Beta of Various stocks in the consumer staples, consumer discretionary, and industrial sectors.   
Source: Data Provided by IEX Cloud, Author Calculations using Microsoft Excel and RStudio

Here's the output from the linear regression model:

Call:
lm(formula = GNRC_Monthly_Return ~ VOO_Monthly_Return, data = VOOandGNRC)

Residuals:
     Min       1Q   Median       3Q      Max 
-0.46400 -0.09209  0.00221  0.10001  0.28690 

Coefficients:
                   Estimate Std. Error t value Pr(>|t|)   
(Intercept)         0.01733    0.02170   0.798  0.42915   
VOO_Monthly_Return  1.19915    0.37646   3.185  0.00273 **
---
Signif. codes:  0 ‘***’ 0.001 ‘**’ 0.01 ‘*’ 0.05 ‘.’ 0.1 ‘ ’ 1

Residual standard error: 0.1415 on 42 degrees of freedom
Multiple R-squared:  0.1946, Adjusted R-squared:  0.1754 
F-statistic: 10.15 on 1 and 42 DF,  p-value: 0.002726

The slope of the line is the beta for the stock. In this linear regression model, the co-efficient of VOO_MonthlyReturn (1.19915) is the beta for Generac Holdings. 

The monthly return statistics for Generac holdings show that the stock has a very high standard deviation of 15% in its monthly returns (Exhibit 4).

Exhibit 4: Generac Holdings Monthly Return Statistics [June 2019 - January 2023]    
Source: Data Provided by IEX Cloud, Author Calculations Using Microsoft Excel

Here are the return statistics for the Vanguard S&P 500 Index ETF during the same period (Exhibit 5).

Exhibit 5: Vanguard S&P 500 Index ETF Monthly Return Statistics  [June 2019 - January 2023]  

Source: Data Provided by IEX Cloud, Author Calculations Using Microsoft Excel

The Vanguard S&P 500 Index ETF and Generac Holdings' monthly returns had a high positive correlation of 0.72 between October 2021 and September 2022 (Exhibit 6).   

Exhibit 6: Monthly Return Correlation of the Vanguard S&P 500 Index ETF and Generac Holdings
Source: Data Provided by IEX Cloud, Author Calculations Using Microsoft Excel and RStudio


Monday, November 28, 2022

Corning's Volatility Compared to the Vanguard S&P 500 Index ETF

Here's the histogram of Corning's (GLW) monthly returns between June 2019 and October 2022 (Click on the image to see a larger version):

Exhibit: Corning's Monthly Returns Fell at or below 2.56% for the Majority of the Months

Data Provided by IEX Cloud, Author Calculations

There were 14 months between June 2019 and October 2022 when Corning's monthly returns were greater than 2.56%.  There were seven months when the monthly returns were greater than or equal to 11.5%.    

Corning's monthly returns have a high positive correlation of 0.66 with the monthly returns of the Vanguard S&P 500 Index ETF (VOO). 

Exhibit: The Vanguard S&P 500 Index and Corning Monthly Returns [June 2019 - October 2022]

Data Provided by IEX Cloud, Monthly Returns Calculated by the Author, Graph using RStudio 

A linear regression of the Vanguard S&P 500 Index ETF and Corning's monthly returns yields a beta of 1.03 for Corning. Corning's average monthly return will mirror the Vanguard S&P 500 Index ETF. Corning may not help diversify a portfolio and will not protect against the market's volatility.  

Here's the linear regression model:

> # Conduct the Linear Regression of the Monthly Returns Between $VOO and $GLW

> lmVOOGLW = lm(GLW_Monthly_Return~VOO_Monthly_Return, data = VOOandGLW)

> # Present the summary of the results from the linear regression

> summary(lmVOOGLW)

Call:

lm(formula = GLW_Monthly_Return ~ VOO_Monthly_Return, data = VOOandGLW)

Residuals:

      Min        1Q      Median     3Q       Max 

   -0.118363 -0.050928 -0.009998  0.041106  0.187435 

Coefficients:

                   Estimate     Std. Error   t value   Pr(>|t|)    

(Intercept)        -0.003778     0.010818    -0.349    0.729    

VOO_Monthly_Return  1.039148     0.188256     5.520    2.4e-06 ***

---

Signif. codes:  0 ‘***’ 0.001 ‘**’ 0.01 ‘*’ 0.05 ‘.’ 0.1 ‘ ’ 1


Residual standard error: 0.06823 on 39 degrees of freedom

Multiple R-squared:  0.4386, Adjusted R-squared:  0.4242 

F-statistic: 30.47 on 1 and 39 DF,  p-value: 2.403e-06

The coefficient for VOO_Monthly_Return [1.039148] is the beta for Corning.  The p-value is significant at a 95% confidence interval. The adjusted R-squared is 0.42, which means about 42% of Corning's average monthly return is explained by the Vanguard S&P 500 Index ETF returns.     

Wednesday, September 21, 2022

Linear Regression of Monthly Returns of Sealed Air Corp and the Vanguard S&P 500 Index ETF

Sealed Air Corporation is a global provider of packaging solutions to various industries. The company provides various packaging products to pack red meat, medical and life science products, cheese, electronics, and other products.  

Exhibit: Sealed Air Corporation Revenue by Region and Product Type

Exhibit: Sealed Air Corporation Packaging Products Revenue by Region and Product Type
(Source: Sealed Air Q2 FY 2022 Investor Presentation on August 2,2022)

Sealed Air has very high volatility. This high volatility may be due to heavy dependency on consumer spending. If consumer spending is weak, they may buy less packaged red meat or packaged cheese, resulting in reduced revenue for the company.  

Here is the graph of monthly returns of Sealed Air (SEE) plotted against Vanguard S&P 500 Index ETF (VOO):
Exhibit 1: Monthly Returns of Sealed Air Corp. and Vanguard S&P 500 Index ETF [June 2019 -  August 2022]
Monthly Returns of Sealed Air Corp. and Vanguard S&P 500 Index ETF [June 2019 -  August 2022]
Monthly Returns of Sealed Air Corp. and Vanguard S&P 500 Index ETF [June 2019 -  August 2022]
(Source: RStudio, ggplot, Data Provided by IEX Cloud)


Results of the linear regression of monthly returns of Sealed Air Corporation against Vanguard S&P 500 Index ETF:

> lmSEEVOO = lm(SEE_Monthly_Return~VOO_Monthly_Return, data = VOOandSEE)
> summary(lmSEEVOO)

Call:
lm(formula = SEE_Monthly_Return ~ VOO_Monthly_Return, data = VOOandSEE)

Residuals:
     Min       1Q   Median       3Q      Max 
-0.13572 -0.03866  0.01319  0.03375  0.14587 

Coefficients:
                    Estimate Std. Error t value Pr(>|t|)    
(Intercept)        -0.002498   0.009056  -0.276    0.784    
VOO_Monthly_Return  1.144479   0.163536   6.998 2.85e-08 ***
---
Signif. codes:  0 ‘***’ 0.001 ‘**’ 0.01 ‘*’ 0.05 ‘.’ 0.1 ‘ ’ 1

Residual standard error: 0.05547 on 37 degrees of freedom
Multiple R-squared:  0.5696, Adjusted R-squared:  0.558 
F-statistic: 48.98 on 1 and 37 DF,  p-value: 2.849e-08

Sealed Air Corporation has a higher volatility than the S&P 500 Index, with a Beta of 1.144. The company's monthly returns positively correlate with the Vanguard S&P 500 Index ETF. The correlation is 0.75.  
The linear regression yields an adjusted R-squared of 0.55, indicating that about 55% of Sealed Air's monthly returns can be explained by the monthly returns of the S&P 500 Index. 
Sealed Air stock may be risky due to its high volatility compared to the market. But, if the stocks are bought at a reasonable or low valuation, they may yield returns that exceed the market's return.   


Tuesday, September 20, 2022

Linear Regression of Monthly Returns of Cisco Systems and the Vanguard S&P 500 Index ETF

Here is the graph of monthly returns of Cisco Systems (CSCO) plotted against Vanguard S&P 500 Index ETF (VOO):

Exhibit 1: Monthly Returns of Cisco Systems and Vanguard S&P 500 Index ETF [June 2019 -  August 2022]

Monthly Returns of the Vanguard S&P 500 Index ETF and Cisco Systems
Monthly Returns of the Vanguard S&P 500 Index ETF and Cisco Systems Inc.

(Source: RStudio, ggplot, Data Provided by IEX Cloud)

Results of the linear regression of monthly returns of Cisco Systems against Vanguard S&P 500 Index ETF:

VOOandCSCO <- read_excel("/CSCO_VOO_LM_September_2022.xlsx", sheet = "Sheet1")
lmCSCOVOO = lm(CSCO_Monthly_Return~VOO_Monthly_Return, data = VOOandCSCO)
summary(lmCSCOVOO)

Call:
lm(formula = CSCO_Monthly_Return ~ VOO_Monthly_Return, data = VOOandCSCO)

Residuals:
      Min        1Q    Median        3Q       Max 
-0.156924 -0.031998 -0.008248  0.038045  0.127839 

Coefficients:
                   Estimate Std. Error t value Pr(>|t|)    
(Intercept)        -0.01062    0.01049  -1.012    0.318    
VOO_Monthly_Return  0.91708    0.18946   4.841 2.31e-05 ***
---
Signif. codes:  0 ‘***’ 0.001 ‘**’ 0.01 ‘*’ 0.05 ‘.’ 0.1 ‘ ’ 1

Residual standard error: 0.06426 on 37 degrees of freedom
Multiple R-squared:  0.3877, Adjusted R-squared:  0.3712 
F-statistic: 23.43 on 1 and 37 DF,  p-value: 2.306e-05

The slope of the regression corresponds to the beta of the stock. In this case, Cisco Systems has a beta of 0.91. 
The adjusted R-squared is 0.37. About 37% of Cisco's monthly return is explained by the returns of the S&P 500 index.  
Cisco Systems cannot protect a portfolio against market volatility since it has a beta value close to 1. Cisco's stock will almost entirely reflect the volatility in the market.      


Monday, September 5, 2022

Linear Regression of Monthly Returns of Colgate-Palmolive against Vanguard S&P 500 Index ETF

Here is the graph of monthly returns of Colgate-Palmolive (CL) plotted against Vanguard S&P 500 Index ETF (VOO):

Exhibit 1: Monthly Returns of Colgate-Palmolive and Vanguard S&P 500 Index ETF [June 2019 -  August 2022]

(Source: RStudio, ggplot, Data Provided by IEX Cloud)

Results of the linear regression of monthly returns of Colgate-Palmolive against Vanguard S&P 500 Index ETF:

> VOOandCL <- read_excel("/CL_VOO_LM_September_2022.xlsx", sheet = "Sheet1")
lmCLVOO = lm(CL_Monthly_Return~VOO_Monthly_Return, data = VOOandCL)

> summary(lmCLVOO)

Call:
lm(formula = CL_Monthly_Return ~ VOO_Monthly_Return, data = VOOandCL)

Residuals:
      Min        1Q    Median        3Q       Max 
-0.084505 -0.025451  0.002263  0.028820  0.122836 

Coefficients:
                    Estimate Std. Error t value Pr(>|t|)   
(Intercept)        0.0002236  0.0067940   0.033  0.97392   
VOO_Monthly_Return 0.3471172  0.1226847   2.829  0.00749 **
---
Signif. codes:  0 ‘***’ 0.001 ‘**’ 0.01 ‘*’ 0.05 ‘.’ 0.1 ‘ ’ 1

Residual standard error: 0.04161 on 37 degrees of freedom
Multiple R-squared:  0.1779, Adjusted R-squared:  0.1557 
F-statistic: 8.005 on 1 and 37 DF,  p-value: 0.007492

The slope of the regression corresponds to the beta of the stock. In this case, Colgate-Palmolive has a beta of 0.34. 
The adjusted R-squared is 0.15. About 15% of Colgate-Palmolive's return is explained by the returns of the S&P 500 index.  
Colgate-Palmolive can protect a portfolio against market volatility since it has a beta value substantially less than 1.    


Saturday, September 3, 2022

Linear Regression of Monthly Returns of Lennox International against Vanguard S&P 500 Index ETF

Here is the graph of monthly returns of Lennox International (LII) plotted against Vanguard S&P 500 Index ETF (VOO):

Exhibit 1: Monthly Returns of Lennox International and Vanguard S&P 500 Index ETF [June 2019 -  August 2022 


(Source: RStudio, ggplot, Data Provided by IEX Cloud)

Results of the linear regression of monthly returns of Lennox International against Vanguard S&P 500 Index ETF:

VOOandLII <- read_excel("/LII_VOO_LM_September_2022.xlsx", sheet = "Sheet1")

lmLIIVOO = lm(LII_Monthly_Return~VOO_Monthly_Return, data = VOOandLII)

> summary(lmLIIVOO)

Call:
lm(formula = LII_Monthly_Return ~ VOO_Monthly_Return, data = VOOandLII)

Residuals:
      Min        1Q    Median        3Q       Max 
-0.090246 -0.052733 -0.001907  0.040310  0.108446 

Coefficients:
                    Estimate Std. Error t value Pr(>|t|)    
(Intercept)        -0.010082   0.009416  -1.071    0.291    
VOO_Monthly_Return  0.995050   0.170040   5.852 9.97e-07 ***
---
Signif. codes:  0 ‘***’ 0.001 ‘**’ 0.01 ‘*’ 0.05 ‘.’ 0.1 ‘ ’ 1

Residual standard error: 0.05767 on 37 degrees of freedom
Multiple R-squared:  0.4807, Adjusted R-squared:  0.4666 
F-statistic: 34.24 on 1 and 37 DF,  p-value: 9.966e-07

The slope of the regression corresponds to the beta of the stock. In this case, Lennox International has a beta of 0.995. Lennox's beta is close to the S&P 500 beta, so Lennox will move in line with the market.  

The adjusted R-squared is 0.46. About 46% of Lennox's return is explained by the returns of the S&P 500 index.  


Paccar: Peak Demand For Trucks

 Paccar ( PCAR ) produced 185,900 trucks in 2022 and is on track for another record year in 2023. The company has experienced good revenue ...