Clorox makes household products such as wipes, sprays, and bleach (Exhibit 1).
Exhibit 1:
 |
| Source: Clorox Website |
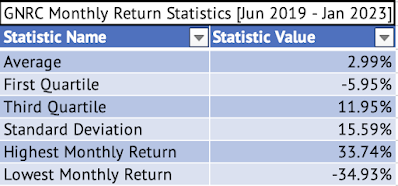
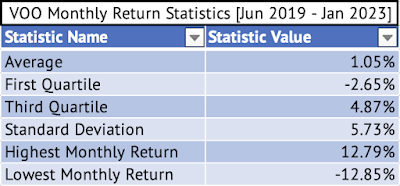
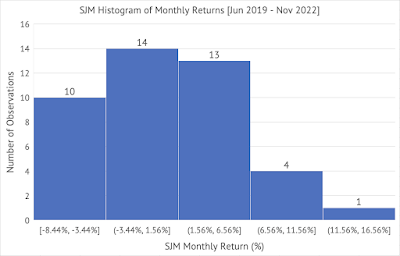
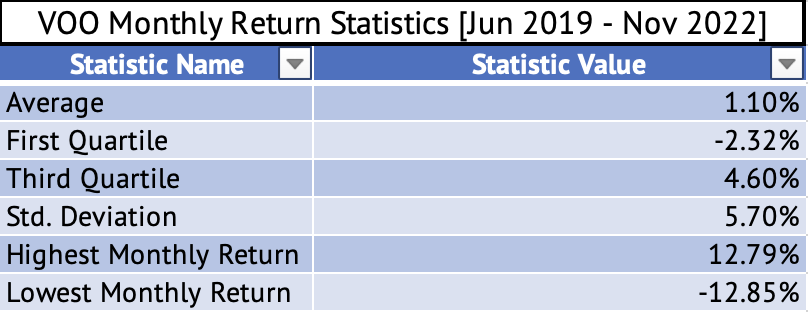
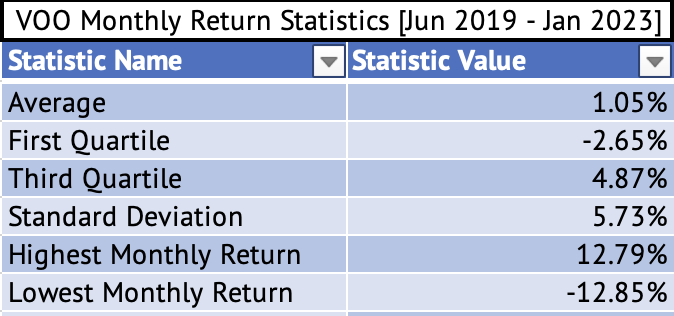
Over the past decade, Clorox has underperformed compared to the S&P 500 Index. An analysis of the monthly returns of Clorox and the Vanguard S&P 500 Index ETF between June 2019 and January 2023 shows that Clorox continued its poor performance. Clorox's monthly return averaged 0.1%, while the Vanguard S&P 500 Index returned 1% (Exhibits 2 & 3). Even the third quartile average monthly return of 3.2% of Clorox fell below the 4.8% returned by the Vanguard S&P 500 Index ETF (Exhibits 2 & 3).
Exhibit 2:
 |
| Source: Data Provided by IEX Cloud, Author Calculations using Microsoft Excel |
 |
| Source: Data Provided by IEX Cloud, Author Calculations using Microsoft Excel |
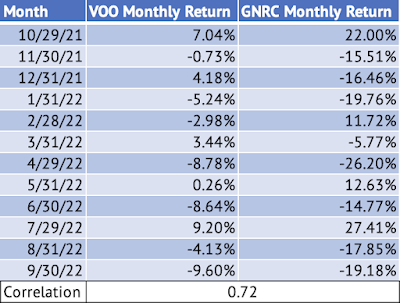
A rolling correlation of the monthly returns conducted using RStudio shows a low positive correlation of 0.02 between August 2020 and July 2021 (Exhibit 4).
Exhibit 4:
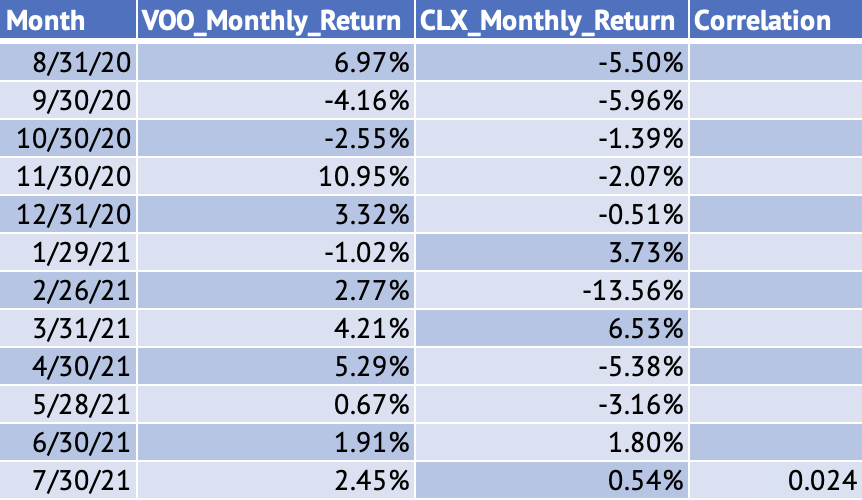 |
| Source: Data Provided by IEX Cloud, Author Calculations using Microsoft Excel, RStudio |
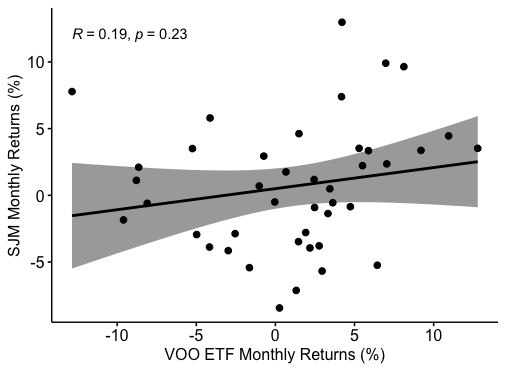
A linear regression of the monthly returns shows a very low beta of 0.25 for Clorox. But, the p-value of 0.1 shows that the relationship may not be significant at the 95% confidence interval.
Call:
lm(formula = CLX_Monthly_Return ~ VOO_Monthly_Return, data = VOOandCLX)
Residuals:
Min 1Q Median 3Q Max
-0.141038 -0.033613 0.000236 0.036959 0.120780
Coefficients:
Estimate Std. Error t value Pr(>|t|)
(Intercept) -0.001581 0.008864 -0.178 0.859
VOO_Monthly_Return 0.252497 0.153777 1.642 0.108
Residual standard error: 0.05781 on 42 degrees of freedom
Multiple R-squared: 0.06032, Adjusted R-squared: 0.03795
F-statistic: 2.696 on 1 and 42 DF, p-value: 0.1081
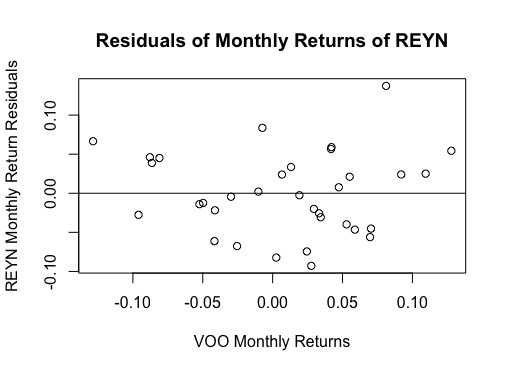
Here's the graph of the monthly returns of the Vanguard S&P 500 Index ETF and Clorox (Exhibit 5) and the residuals plot from the linear regression (Exhibit 6).
Exhibit 5:
 |
| Source: Data Provided by IEX Cloud, Author Calculations using Microsoft Excel, RStudio |
 |
| Source: Data Provided by IEX Cloud, Author Calculations using Microsoft Excel, RStudio |