Showing posts with label Wind Energy. Show all posts

Saturday, October 1, 2022

Volatility of Monthly Returns of Timken Compared to the Vanguard S&P 500 Index ETF

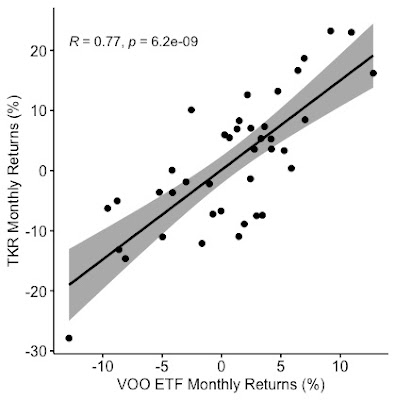
Here is the graph of monthly returns between June 2019 and September 2022 of Timken (TKR) plotted against Vanguard S&P 500 Index ETF (VOO):

Exhibit: Monthly Returns of VOO and TKR between June 2019 and September 2022

Monthly Returns of VOO and TKR between June 2019 and September 2022
(Source: Data Provided by IEX Cloud, Monthly Returns Calculated in Microsoft Excel, Graph Plotted in R Studio using ggplot package)
Click on the image to enlarge it.

The monthly returns of Timken have a very strong positive correlation of 0.77 with the S&P 500 Index. The very low p-value (p = 6.2e-09) indicates that the monthly returns of the S&P 500 Index have an effect on Timken's monthly returns.  

The Beta value indicates the monthly return volatility of Timken compared to the S&P 500 Index. Yahoo Finance provides a Beta value of 1.59 based on monthly returns over the past five years. A linear regression of the monthly returns between June 2019 and September 2022 yields a Beta of 1.48. The coefficient of Vanguard's monthly return is the volatility of Timken. The coefficient is the linear regression line's slope and Timken's Beta value. In other words, as the monthly return of the Vanguard S&P 500 Index ETF changes by 1%, Timken's monthly return can change by an average of 1.48%.  

Timken's Beta value is one of the highest I have seen. Here are the Beta values of some of the stocks in another post on this blog.  

Here's the output of the linear regression between the monthly returns of Vanguard S&P 500 Index ETF and Timken:

Call:

lm(formula = TKR_Monthly_Return ~ VOO_Monthly_Return, data = VOOandTKR)

Residuals:

      Min        1Q    Median        3Q       Max 

-0.132602 -0.047815 -0.000585  0.059694  0.137770 

Coefficients:

                   Estimate Std. Error t value Pr(>|t|)    

(Intercept)        0.001198   0.011348   0.106    0.916    

VOO_Monthly_Return 1.489061   0.199966   7.447 6.17e-09 ***

---

Signif. codes:  0 ‘***’ 0.001 ‘**’ 0.01 ‘*’ 0.05 ‘.’ 0.1 ‘ ’ 1

Residual standard error: 0.07103 on 38 degrees of freedom

Multiple R-squared:  0.5934, Adjusted R-squared:  0.5827 

F-statistic: 55.45 on 1 and 38 DF,  p-value: 6.168e-09  
  

Sunday, January 2, 2022

Energy Transition will be Messy and Expensive. Hold on to Your Barrel of Oil for Now.

Many people anticipate that electric vehicles will win the transportation race and replace the internal combustion engine. Many journalists and energy experts have been warning for a while that the transition from fossil fuels to renewables will be messy. Daniel Yergin says that we are in an energy-mix era

Lithium - one of the critical materials used in batteries - is in short supply, and its prices have increased by 5x. Electric vehicle battery costs are set to increase for the first time in a decade. 

Meanwhile, European Union is beginning to realize that they cannot simply abandon nuclear power and still keep the lights on. They plan to classify nuclear power and natural gas as "green" power sources. In my opinion, there is no such thing as fully green energy. For example, lithium mining and mining for other materials in producing an electric vehicle are damaging to the economy. The world needs good recycling technology to create a circular economy and minimize emissions and environmental damage.       

General Motors Ultium Battery and Global Vehicle Platform for Electric Vehicles.
(Source: General Motors)

The surge in oil prices in the past year, coupled with the reluctance of oil companies to invest in new oil discoveries, could lead to higher energy prices and even an energy shock. This lack of investment in new oil supplies could increase inflation.   

Saturday, July 18, 2020

Iberdrola and Orsted - The Global Renewable Energy Giants

      This was the headline from the Financial Times that caught my eye:

(Source: FT.com)
    The article talked about how the US spending on wind power is set to go from zero 10-years ago to $78 billion in the 2020 decade. That is a truly astounding turnaround in the fortunes of the renewable energy sector. A couple of years ago I had heard of this renewable energy company called Iberdrola from Spain. At that time I briefly read about it in the financial news and did not do an in-depth research into that company. This headline spurred me to action. We are in the midst of a far-reaching energy transformation that could transform every aspect of life by the year 2035. I wanted to learn more about not just Iberdrola but also Orsted - which is another renewable energy giant from Denmark. I don't remember hearing about Orsted until it was mentioned in this Financial Times article.
    Iberdrola comes from a very long history that dates back to the 20th century. The Wikipedia entry for the company makes for a fascinating read. Today it is one of the largest energy companies in the world with subsidiaries in multiple nations across the globe. Its subsidiary in the U.S. is called Avangrid. Avangrid has about 7,000 employees in the U.S and is headquartered in Orange, Connecticut. Iberdrola had revenues of € 36,437 million in 2019. In 2018 its revenues were € 35,075. Its EBITDA exceeded € 10 billion for the first time in 2019. Avangrid is traded in the U.S stock markets in the NYSE under the symbol AGR
    Orsted on the other hand had total revenue of DKK 67,842 million in 2019 (€ 9,113 million Exchange rate as of July 18, 2020: 1 Danish Krone = € 0.13). In 2018 the company had revenues of DKK 76,946 million (€ 10,336 million). Orsted had EBITDA of DKK 17.5 billion (€ 2.35 billion) in 2019.             


The Costco Paradox

What can we learn from the success of Costco? Summary: ...