Snowflake Cortex AI Product Stack (Source: Snowflake)
📊 Are you an asset
manager, investment professional, or anyone dealing with large volumes
of text data? Learn how to extract valuable insights from earnings press
releases, SEC filings, and other text-heavy documents in just 40
minutes! 🚀 Excited to share my new Snowflake Notebook that demonstrates the power of Snowflake Cortex LLM SQL functions! You can download the Notebook here. 🎯 In just 30-40 minutes, discover how to: • Classify text and assess sentiment. • Parse and split documents efficiently • Handle unstructured text data with ease • Leverage Cortex Search for document Q&A • Cortex Search is a hybrid vector and keyword search - a fascinating, easy-to-use search tool for enterprise data. 💡
Perfect for anyone wanting to explore Snowflake's LLM capabilities
without complex setups. I've used real-world examples with Earnings
Press Releases from US-listed companies to demonstrate practical
applications. 🔍 What you'll learn: - CLASSIFY_TEXT - COMPLETE - EXTRACT_ANSWER - SENTIMENT - SUMMARIZE - PARSE_DOCUMENT - SPLIT_TEXT_RECURSIVE_CHARACTER functions - Document search and Q&A using Cortex Search ⚡️ Ready to dive in? Download the notebook from Github and start your LLM journey with Snowflake today!
How much cash does the U.S. Federal Government carry on its balance sheet?
How does that cash compare to the money on Big Tech's balance sheet?
How is Big Tech spending on share repurchases?
Theoretically, how much cash could Big Tech have on its balance sheet, including the repurchase amounts?
How much cash does the U.S. Federal government carry in its Balance Sheet?
The U.S. Treasury Department owns and publishes the government's balance sheet annually. At the end of 2023, the U.S. government held $922 billion in cash (Exhibit 1). Although the Federal government, with congressional authorization, can print money to bolster its balance sheet at any time, we are using this amount as a fun exercise to compare against the cash held by the private sector, especially by the tech giants.
Exhibit 1: Assets Portion of the U.S. Government Balance Sheet
Bureau Of Fiscal Service
How does the federal government's cash holding compare to the private sector?
I queried the U.S. SEC filings using Snowflake to examine the cash held by various companies (Exhibit 2). I wanted to examine Big Tech but also threw in data from other companies, from Berkshire to Coca-Cola. Berkshire Hathaway had to be included in this list since its cash, bonds, and securities on its balance sheet total over $325 billion. The table below details only the cash holdings without looking at long-term bonds and securities companies may hold.
Warren Buffett believes in having a fortress balance sheet and has been selling his stock positions in Apple and Bank of America to bolster it over the past few quarters. So, what does Warren know about the markets that concern him? There's a cottage industry trying to guess Buffett's thinking and investment strategy. Buffett may be saying that U.S. stocks are overvalued, so it's time to cash in on the capital gains he has secured on Apple. My guess is as good as yours. If the market takes a beating in the coming months, Warren might be in a prime position to buy excellent businesses at a cheaper valuation.
Note: It was easy to create an AI app in Snowflake to learn from Warren Buffett's annual letters. You can learn about it here.
Amazon has the highest cash position, with $75 billion on its balance sheet, followed by Meta (Facebook), which has $43 billion. The top 10 companies on this list, from Amazon to Salesforce, held $273 billion in cash.
Note: Procter & Gamble (PG) data has a bug since the cash position is for 2019. I hypothesize that PG started using a different US GAAP tag after the 2019 fiscal year than the one I used in my query. I will look into this. You can learn more about my architecture in a series of blogs here and here.
Exhibit 2: Cash Held By U.S. Companies
Cash Held By U.S. Companies.
This amount of cash on the balance sheet feels tiny compared to many big tech companies' annual free cash flows. Where did all the money go?
How much is Big Tech spending on share repurchases?
Share repurchase is a financial technique companies use to buy back their shares. Repurchases reduce the total outstanding shares, offering multiple benefits to the company and its shareholders.
Companies can show earnings per share growth without increasing earnings from their business operations.
Existing shareholders see their stake in the business increase. Now, they own more of the business.
Reduce the total dividend that the company has to pay out annually.
If you and your friend were partners in a business and you bought out your friend's share, you would end up owning 100% of the company and keeping all the profits. Share repurchases are similar, except on a much bigger scale.
Let's look at an example to see the benefits of share repurchases.
Exhibit 3: Share Repurchase Example
Share Repurchase Example
Suppose a company had a net income of $1000 and a total outstanding shares of 10 in year 1. In this case, its earnings per share (EPS) is $100. Suppose the company earns the same amount of $1000 in net income in year 2 but repurchased 2 of its shares at the end of year 1. The number of outstanding shares is now eight instead of 10. The EPS has jumped from $100 to $125, a remarkable 25% increase without the business earning a single penny more. When EPS grows, the stock price should follow, benefitting the company and its shareholders.
When paying dividends to existing shareholders, share repurchases save the company money, assuming it decides not to increase its dividend per share. In this example, the total dividend amount the company has to pay is reduced from $100 to $80.
In the partnership example, when you buy out your friend, you would consider paying a fair price for his share of the business. You would be careful not to overpay. If you overpay, the returns you generate on your investment will be less. Similarly, buying back shares at any valuation is not recommended. Warren Buffett's rule on buybacks is only to repurchase shares when the stock is trading below its intrinsic value.
How much did Apple spend on buying back its shares?
Since 2018, Apple has spent a mammoth $559 billion on buying back its shares (Exhibit 4 & 5).
Exhibit 4: Amount of Money Apple Has Spent on Share Repurchase Since 2018.
Apple Share Repurchases
Exhibit 5: Apple's Spending on Share Buy Backs in Bar Chart Form.
Apple's Share Repurchases
How much has Apple managed to reduce its share count since 2018?
Apple has reduced its total outstanding shares from 20 billion to 15.4 billion, a 22% reduction.
Exhibit 6: Apple's Weighted Average Diluted Shares Outstanding
How much did Microsoft spend on buying back its shares?
Microsoft has spent $152 billion on share buybacks since 2018 (Exhibits 7 & 8).
Exhibit 7: Microsoft's Spending on Share Repurchases
Microsoft's Spending on Share Repurchases
Exhibit 8: Microsoft's Spending on Share Repurchases in Bar Chart Form
Microsoft's Repurchases.
How much has Microsoft managed to reduce its share count since 2018?
Microsoft has reduced its outstanding shares from 7.79 billion to 7.46 billion, a 4.2% reduction (Exhibit 9).
Exhibit 9: Microsoft's Outstanding Shares.
Microsoft's Outstanding Shares
In theory, Big Tech could have more money on its balance sheet than the Federal government if desired. It spends a lot on Capex, R&D, and share repurchases.
Note: All data analysis was done on Snowflake using Snowsight Worksheets and Snowflake Notebooks. If you like the analytics presented here and wish to do similar analytics with your data, Snowflake may be the easiest platform to gain insights quickly. Try Snowflake for free for 30 days here.
Disclosures: I am a Sales Engineer at Snowflake. All opinions in this blog post are solely mine and do not reflect Snowflake's views. I am not a Registered Investment Advisor, and any discussion on securities or investments is not an inducement to make a particular investment.
How much do Adobe, Salesforce, and others spend on Research and Development (R&D)?
How has the R&D expense changed over time?
What can we infer about the impact of GenAI on R&D expenses?
In this post, we examined Microsoft's capital expenditures (capex) as a proxy for the billions of dollars hyper-scaler cloud providers are investing in AI. Who is consuming this capex? We will answer this fundamental question in this post. Most people may already know the answer to this question. Cloud providers are packaging Nvidia GPUs into various IaaS services, offering them to companies such as Adobe, ServiceNow, Salesforce, and every other company in every industry experimenting with GenAI. These companies' investments in AI show up in research and development expenditures in the income statement.
The AI Money Flow
Here's how the investments in AI flows through various companies. Let's look at each step.
Taiwan Semiconductor Manufacturing Company (TSMC) brings Nvidia's dreams to the market.
Dell, HP, and other server manufacturers, primarily based in Asia, buy these GPUs from Nvidia and package them into servers. The cost of the GPUs is included in the server manufacturers' Cost of Goods Sold (COGS).
Cloud providers purchase these servers. The cost of these AI servers is included in the capital expenditures.
Companies worldwide purchase IaaS and PaaS services created by cloud providers to experiment with and create various AI products and services for their customers.
Github Copilot, Salesforce's Einstein AI, ServiceNow AI agent, Apple Intelligence, and other products are examples of GenAI in the marketplace.
Once a product is ready to be released, companies typically create a SaaS service and introduce their GenAI products to consumers and other companies across various industries.
Consumers and companies pay for the GenAI service. Many services currently have a free and paid tier. The free service may typically have some restrictions on product use.
Companies such as Apple, Delta Airlines or Expedia build Chatbots, which they hope would help increase revenue, reduce the cost of serving their customers and thus boost their profit margins. But, most companies bringing GenAI products to market will have to see cost reductions in their operations soon or generate a profitable revenue stream.
Note about #2:
By now, most people are familiar with Jensen Huang, the unassuming, charismatic Nvidia founder. Most people probably have never heard of Morris Chang - the unassuming, spotlight-shunning, nonagenarian Taiwan Semiconductor Manufacturing Company (TSMC) founder. Here are a couple of articles to learn more about him:
The cloud providers themselves are massive users of the GPUs they purchase. Internal product teams at Amazon and Microsoft are experimenting with and creating new GenAI products. These product development expenses appear as research and development (R&D) expenses. So, in addition to spending billions on capital expenditure, Amazon, Microsoft, and Google are racing to create new genAI products and, in turn, invest billions more in R&D.
Companies like Adobe, Apple, ServiceNow, Salesforce, and others are investing in GenAI R&D to create new products. Since Adobe, ServiceNow, and others do not buy the GPUs directly and maintain, for the most part, their own data centers, they rely on the cloud providers for their GPU and include the cost of buying those services in R&D. In this post, we will examine how those R&D expenses have changed for these companies with the advent of GenAI.
Note about #7:
When a product is released to the market by the R&D teams, the responsibility of maintaining the service is turned over to the Cloud Operations and Support teams at Adobe, Salesforce, ServiceNow, and others. The cost of providing these services to customers and the associated GPU use is included in the cost of goods sold (COGS).
Research and Development Spending By Companies
Apple's R&D Spending
Apple is one of the largest companies on the planet in terms of revenue, profits, and market value. They have also been slow to announce AI services, only recently announcing Apple Intelligence. Apple is a big R&D spender with one of the largest R&D budgets in the world. Apple spent nearly $30 billion on R&D in 2023.
Apple has increased its R&D budget by 38x since 2007. With the GenAI race just getting started, I do not see these massive expenses abating anytime soon. When you look at the chart below the R&D expense (yellow bar) compared to Revenue (blue bar) looks so tiny.
In fact, Apple only spent 7.8% of revenue on R&D. But, this is the company's highest spend in terms of dollar amounts and as a percent of revenue. The company increased its R&D spend by 114 basis points from 2022, adding over $3 billion to its R&D expense. Apple's motivation to release AI products and services may be behind this increase in R&D expense, especially at a time when its revenue declined from 2022 to 2023.
Chart: Apple's Annual R&D Spending Compared to Revenue
Created Using Snowflake Snowsight
Table: Apple's R&D Expense As a Percent of Revenue.
Queried in Snowflake, Table Formatted in Excel
Salesforce's R&D Expense
Let's look at R&D spending by Salesforce and how that's changed over time and feeling the pressure to invest in GenAI. Here's Salesforce's R&D expense compared to its annual revenues.
Chart: Salesforce's Revenue (blue bar) and R&D Expense (yellow bar)
Created Using Snowflake Snowsight
Table: Salesforce's Revenue and R&D Expense as a Percent of Revenue
Queried in Snowflake, Table Formatted in Excel
Salesforce has been spending above 14% of its revenue on R&D since 2017, well above Apple's expenditure in this category. Salesforce has probably decided that it is spending much on R&D already and only needs to reallocate, prioritize funds and teams to focus on GenAI projects.
Microsoft's R&D Expense
Microsoft is already spending plenty on capex. It is spending billions more on R&D. But as a percent of revenue, the company has not increased its spending. On dollar terms Microsoft has definitely increased it spending. Its R&D expense as a percent of revenue in 2024 was lower compared to 2023. But, in dollar terms the company increased its spending by over $2 billion.
Chart: Microsoft Revenue and R&D Expense
Created Using Snowflake Snowsight
Table: Microsoft's Revenue, R&D Expense, and R&D as a Percent of Revenue
Queried in Snowflake, Table Formatted in Excel
Companies that have were already spending well above 10% on R&D have probably prioritized the budgets with a focus on GenAI. Megatech companies such as Apple and Microsoft have increased their R&D expense by a few billion dollars. These fresh dollars are mostly likely focused on creating new AI products and services.
Disclosures: I am a Sales Engineer at Snowflake. All opinions in this blog post are solely mine and do not reflect Snowflake's views. I am not a Registered Investment Advisor, and any discussion on securities or investments is not an inducement to make a particular investment.
The S&P 500 index is market-capitalization-weighted. The weighting by market cap means the companies with the largest market capitalization (Market capitalization = Number of shares outstanding x Share Price) get the highest weight. Last year, this method for calculating the index made the five largest companies by market cap account for 23% of the index. That is just 5 out of the 500 companies accounting for about a quarter of the market capitalization. These five companies were: Apple, Microsoft, Alphabet (Google), Amazon, and Facebook (Meta). When the share price of these companies starts underperforming, the market takes a huge tumble. We can see that happening now. The S&P 500 index (VOO) is down about 9.72% (pre-market on January 28), while the S&P 500 equal-weighted ETF (RSP) is down 7.48% (See Exhibit 1: Invesco Equal-Weight ETF Beats Vanguard S&P 500 Market-Cap Weighted ETF). That is a difference in the performance of 224 basis points. In essence, the equal-weight ETF outperformed the market-cap ETF. The dividend yield is about the same for both ETFs. The Invesco Equal-Weight ETF charges a higher expense ratio than the Vanguard S&P 500 ETF. Invesco charges 20 basis points (bps) or 0.2%, while the Vanguard S&P 500 ETF (VOO) charges three bps or 0.03%. Invesco charges 7x more than the Vanguard ETF. Even after deducting the extra expense of investing in the Invesco ETF, it comes ahead in performance by over 200 bps.
The era of big-tech is coming to an end due to more regulation and their size inhibiting growth. At least for now, Apple seems to be bucking the trend after reporting blockbuster results yesterday. Interest rates are also rising, putting pressure on valuation because future earnings will be discounted at a higher interest rate. It may be good to have a position in the Invesco Equal-Weight ETF (RSP) during these times.
Salesforce (CRM) grew at a breakneck speed over the past two decades. The is hoping that the growth will continue in this decade.
The company's free cash flow yield is very similar to that of Microsoft (MSFT) and Adobe (ADBE). Salesforce's free cash flow yield has been consistently around the 2% level over the past decade. Microsoft and Adobe have seen their market capitalization and earnings multiple expand over the years causing their free cash flow yield to drop. I might have to look into their number more closely.
Exhibit: Free Cash Flow Yield
(Source: Seeking Alpha)
Salesforce is lagging behind Microsoft (MSFT) and Adobe (ADBE) on return on equity. Both those companies have more than 8x more return on equity than Salesforce.
Exhibit: Return on Equity
(Source: Seeking Alpha)
Microsoft and Adobe have 6x and 8x more return on invested capital (ROIC) compared to Salesforce.
Exhibit: Return on Invested Capital
(Source: Seeking Alpha)
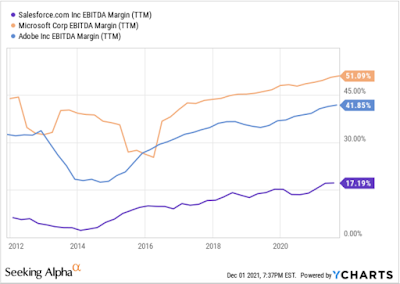
Salesforce's EBITDA margin is much lower than that of Microsoft and Adobe.
Exhibit: EBITDA Margin
(Source: Seeking Alpha)
Salesforce's EV to EBITDA multiple is higher than that of Microsoft and Adobe.
Exhibit: EV to EBITDA Multiple for Salesforce, Microsoft, and Adobe.
(Source: Seeking Alpha)
Salesforce's year-over-year quarterly revenue growth (See Exhibit: Year-over-Year Revenue Growth) has converged with Microsoft and Adobe.
Exhibit: Year-over-Year Revenue Growth
(Source: Seeking Alpha)
Salesforce's price to earnings growth ratio (See Exhibit: Salesforce, Microsoft, and Adobe PEG Ratio) was attractive during the past decade compared to Microsoft and Adobe. If the company's growth can continue, that would justify its higher valuation multiple compared to Microsoft and Adobe. Salesforce's revenue is already in the high $20 billion, so for it to grow at a 20% rate would take some work.
Exhibit: Salesforce, Microsoft, and Adobe PEG Ratio
Western Digital (WDC) Saw its revenue increase by 18% YoY. It had another record quarter for its flash storage business. Two out of its three business segments did very well. How many companies in today's economy can actually say that it's growing revenue at a double-digit pace? If you look at the Dow Jones Industrial Average (DJIA) 20 out of 30 companies in that index saw YoY EPS decline.
Exhibit: WDC showed good revenue growth in Q4 FY 2020
Its Data Center business continue growing and its revenue increased 32% YoY. Its Client Devices business grew revenue by 19% YoY. But due to the closure of retail stores because of the pandemic, its Client Solutions business suffered.
The company has made it a priority to pay down debt. Its gross margins have shown improvement but it could improve further. Gross margin percentage has gone from 24.2% in Q4 FY 2019 to 28.9% in Q4 FY 20.
For example, the company's non-gaap gross margins were at 43% in Q2 of FY 2018. So, it's possible for Western Digital to improve its gross margins substantially.
Exhibit: In Q2 FY 2018 WDC had Good Gross Margins. It's possible for WDC to get to this level again.
Both Apple (AAPL) and Microsoft (MSFT) are trading below its 10-day moving average. Apple is down from its 52-week high of $399.82 and currently trades at $380.16. That's a drop from the 52-week high of - 4.97%. Apple's 10-day moving average is 382.436 (Tuesday, July 28, 2020). Microsoft is down from $216.38 to $204.06 that's a -5.6% change. Its 10-day moving average is $202.15. Amazon (AMZN), Facebook (FB), and Alphabet (GOOG) are all trading below their 10-day moving average. Out of this cohort only Facebook is trading below its 50-day moving average.
Exhibit: Big Tech's Downturn has Started. When will it end?
Microsoft has gained 53% from its lows in March 2020. Apple has gained 76% form its March 2020 lows. The gains have been spectacular. Google has gained 50% from its March lows. Amazon has gained nearly 82% from its March 2020 lows.
It seems like all these stocks are starting a downward trend after the huge run-up they have had over the last few years and the rebound they have had since the pandemic induced crash of March 2020.