Showing posts with label stock. Show all posts

Tuesday, January 31, 2023

Why is the stock of Goodyear Tire & Rubber Co. So Volatile?

Goodyear (GT) is a very volatile stock with a beta of 1.86, measured using a linear regression model. This linear regression model used monthly returns for Goodyear and the Vanguard S&P 500 Index ETF (VOO) from June 2019 to January 2023. This beta is one of the highest I have encountered among the stocks I cover (Exhibit 1).

Image: 90% Sustainable Material Demonstration Tire

Source: Goodyear Tire & Rubber Co.


The stock is heavily dependent on the discretionary spending of the consumer. In a downturn, car sales drop, thus affecting Goodyear's sales. The replacement tire sales also drop in an economic slowdown, affecting the company. These might be the reasons behind the high volatility.   

Note: Please click on the image to see an enlarged version.

Exhibit 1: Beta of Stocks in Industrial, Consumer Staples, Technology, and Consumer Discretionary Sectors  

Source: Data Provided by IEX Cloud, Author Calculations using Microsoft Excel & RStudio


Here's the output from the linear regression model:

Call:
lm(formula = GT_Monthly_Return ~ VOO_Monthly_Return, data = VOOandGT)

Residuals:
     Min       1Q   Median       3Q      Max 
-0.21099 -0.10456 -0.01782  0.07052  0.55012 

Coefficients:
                    Estimate Std. Error t value Pr(>|t|)    
(Intercept)        -0.008481   0.021853  -0.388      0.7    
VOO_Monthly_Return  1.869864   0.379106   4.932 1.33e-05 ***
---
Signif. codes:  0 ‘***’ 0.001 ‘**’ 0.01 ‘*’ 0.05 ‘.’ 0.1 ‘ ’ 1

Residual standard error: 0.1425 on 42 degrees of freedom
Multiple R-squared:  0.3668, Adjusted R-squared:  0.3517 
F-statistic: 24.33 on 1 and 42 DF,  p-value: 1.326e-05

The coefficient for "VOO_Monthly_Return" is the beta for the stock.  This coefficient is also the slope of the line.  The monthly returns of Goodyear have been plotted against the returns of the Vanguard S&P 500 Index ETF (Exhibit 2). Exhibit 3 shows the residuals from the linear regression mode. There is a solid positive monthly return correlation of 0.61 between the Vanguard ETF and Goodyear. There is also a significant relationship between the monthly returns of the Vanguard ETF and Goodyear, with a p-value of 1.3e-05.     

Exhibit 2: Monthly Returns Plot of the Vanguard S&P 500 Index ETF and Goodyear Tires

Source: Data Provided by IEX Cloud, Author Calculations Using Microsoft Excel, and Graph Plotted Using RStudio


Exhibit 3: Residuals from the Linear Regression of the Vanguard S&P 500 Index ETF and Goodyear Tires Monthly Returns
Source: Data Provided by IEX Cloud, Author Calculations Using Microsoft Excel, and Graph Plotted Using RStudio


Sunday, December 12, 2021

Oracle: Excelling in Financial Engineering.

Oracle (ORCL) faced its first real challenge to its business model from Amazon AWS (AMZN). For a long time, Oracle's relational database has been the standard for many companies in the Global 2000. Oracle's database is still so entrenched in many corporations across the globe that they pay millions of dollars in Oracle license and support fees each year to keep the right to use their software. But, companies formed in the last 10-15 years have shunned the Oracle database. Instead, they have relied on myriad open-source database options and cheaper databases from other companies. The advent of AWS made it easy for any company to manage databases in the cloud. 


Oracle has lagged behind the prominent three cloud vendors in offering infrastructure-as-a-service (IaaS). The company has a reasonably significant market share position in SaaS software, where it competes against the likes of Salesforce (CRM), Workday (WDAY), and SAP (SAP). But, Oracle is still heavily dependent on revenue from its database software. Since Oracle cannot attract new customers to its database, it has resorted to using its existing database install base as an annuity business. In essence, the Oracle database software generates much rental income from its remaining customers.  


In the face of Oracle management's inability to innovate and compete, they have resorted to financial engineering to prop up their share price. A company innovating and competing well in the marketplace is most likely growing revenues. At the very least, revenue growth needs to keep up with GDP growth. Unfortunately, there is no revenue growth at Oracle. In the fiscal year ending May 31, 2011, Oracle had total sales of $35.622 billion. In the fiscal year ending May 31, 2021, Oracle had total sales of $40.479 billion. That equates to a 13.6% growth in revenue over 11 years. The 13.6% rate amounts to a compound annual growth rate (CAGR) of 1.16%

Exhibit: Oracle Annual Sales Revenue from Fiscal Year Ending on May 31, 2011

(Source: SEC.GOV)

How does a company show earnings per share (EPS) growth when revenue growth is nonexistent? Investors react positively to a growing EPS number. One way to show an ever-increasing EPS number is to repurchase the company shares and retire them. The repurchase transaction reduces the outstanding shares, and thus when stagnant net income is divided by outstanding shares, the resulting EPS number looks as if it is growing. 

The company has spent billions of dollars each year repurchasing its stock. The company has spent $137.65 billion in repurchasing its shares in 11 years. Initially, the share repurchases did not do much to the stock price. So, in recent years, the company has gotten even more brazen in buying back its stocks (See Exhibit: Annual Amount in Billions Spent by Oracle on Share Repurchase).  

Exhibit: Annual Amount in Billions Spent by Oracle on Share Repurchase 

(Source: SEC.GOV)
One way to analyze how much the company has spent on its repurchase is to compare its operating cash flow to the repurchase amount. The company had $155.212 billion in operating cash flow in 11 years and it spend 88.6% of that in buying back its own shares.
 
Exhibit: Oracle's Annual Operating Cash Flow

(Source: SEC.GOV)
In the end, Oracle's management led by Safra and the company's largest shareholder - Larry Ellison - benefit the most from these buybacks. Larry is now on the list of the top-10 wealthiest people in the world solely due to these buybacks. Due to these buybacks, the stock has risen a lot, and ordinary investors should prudently book profits. You do not want to be in this stock when the music stops.  


Saturday, December 11, 2021

Why ViacomCBS's Preferred Shares (VIACP) are a Great Buy Currently Offering 10.68% Dividend Yield?

In January 2021, during the start of the meme stock bubble, ViacomCBS (VIAC) stock started climbing from about $36. The stock kept on climbing until March 22, 2021, when it traded briefly above $100. Other than a few Wall Street banks, nobody knew why it was rising. Even the Wall Street banks did not have a complete picture. It was also around the Super Bowl, so CNBC host Jim Cramer speculated that it might have had something to do with all the Paramount+ ads that aired during the Super Bowl. Paramount+ is ViacomCBS's streaming brand. 

But, Bob Bakish, the CEO of ViacomCBS, did not care about why the stock was rising. He needed all the money he could get to feed his company's push into the streaming business, and with the stock trading at an all-time high, he decided to make use of the opportunity. So, the company sold 10 million preferred shares at $100 with a 5.75% yield and issued a further 20 million of class B common stock. The class B common stock causes immediate dilution of existing shareholders.

Exhibit: The Spike in the Price of ViacomCBS During the Archegos Scandal 

(Source: Seeking Alpha)

The dividend on the preferred works out to a quarterly dividend of $1.435. The preferred shares have a mandatory conversion clause that would take effect in April 2024. The preferred shares will convert between 1.0013 and 1.1765 into ViacomCBS common shares. Since the preferred stock is currently trading below the offer price of $100, each preferred share would be converted to a maximum of 1.1765 shares of the ViacomCBS common shares.  

Once Bob made this announcement about the issuance of the common and preferred shares, the stock promptly tanked. Soon it became clear that ViacomCBS and Discovery (DISCA), Inc (home of HGTV, Food Network, and other channels, were both caught up in the Archegos Capital Management scandal that nearly brought down Credit Suisse. Other Wall Street banks booked millions of dollars in losses when they allowed Bill Hwang (owner of Archegos Capital Management) to speculate on the stocks of ViacomCBS and Discovery. Credit Suisse booked over $5 billion in losses due to the scandal.

Exhibit: Spike in Discovery Shares During the Archegos Scandal

(Source: Seeking Alpha)

The stock has flat-lined lately due to increased competition in the streaming business and the increased cost of customer acquisition. Did you notice the deal that Discovery was offering during the 2021 Thanksgiving break? Discovery offered three months of subscription at $0.99 per month.     


ViacomCBS is a solid company with good cashflows, and its content library is top-notch. The preferred stock now offers a 10.6% dividend yield, which you can get until 2024. In early 2024, we can decide to either stay invested in the preferred shares or exit before the mandatory conversion date in April.


The debt to EBITDA multiple is at 4x. So, debt is a concern, and I prefer to see companies at a debt to EBITDA multiple 2x. One caveat to remember is that Discovery is acquiring Warner Media from AT&T. Discovery will have a 5x debt to EBITDA after the acquisition.

Exhibit: Debt to EBITDA Ratio for ViacomCBS, Walt Disney Co., and Discovery 

(Source: Seeking Alpha)
The high level of debt may be negative, but the company has the cashflows to cover it. Its quick ratio is above 1 indicating that the company has the liquidity to cover the current liabilities.  

Exhibit: Quick Ratio for ViacomCBS, Walt Disney Co., and Discovery
(Seeking Alpha)
 
The company's return on equity is much higher than that of Walt Disney and Discovery and comes in at around 18%. 

Exhibit: Return on Equity for ViacomCBS, Walt Disney, and Discovery

(Source: Seeking Alpha)

Its return on invested capital is higher than that of Walt Disney and Discovery.  

Exhibit: Return on Invested Capital for ViacomCBS, Walt Disney, and Discovery

(Source: Seeking Alpha)
I own both ViacomCBS Class B (VIAC) and the preferred stock (VIACP).  I also own Discovery (DISCA), and Walt Disney (DIS). But, I am most bullish about ViacomCBS. They have already acquired over 43 million customers. They have a customer acquisition deal with T-mobile to offer their Paramount+ subscription as part of their plan. That should bring in millions more customers to ViacomCBS.  
Exhibit: Paramount+ Subscription Included in T-Mobile Cell Phone Service 
(Source: T Mobile)

Finally, the company is trading at an EV to EBITDA multiple of just 6x and Discovery is trading at just around 3x. Disney is trading at an EV to EBITDA multiple of 34x. Both ViacomCBS and Discovery are trading at steep discounts. Yes, the competition is intense and the customer acquisition cost is high, but the content is top-notch. All media companies need content more than ever. But ViacomCBS will thrive in the long term.  The ViacomCBS' dividend on the preferred and the common is too good to pass up.       


Wednesday, March 10, 2021

Equinix: Technical Set-up Looks Good

 Equinix (EQIX):

EQIX has been on BofA US 1 list for a long time. It seemed to be very expensive, finally it has come back down and I have opened a position today at $640. Actually, I wish I had picked it up yesterday.
$EQIX's Technical Set-up 
  1. Trading near the bottom of the bollinger bands
  2. Money Flow Indicator flashing oversold
  3. RSI just coming-off of oversold territory.  
  4. On-balance Volume is negative indicating oversold
Exhibit: Equinix Technical Indicators
(Source: E*Trade)


Monday, August 17, 2020

Bank of America Adds AES Corp to US1, Removes Ameren Corp.

On August 13, 2020, Bank of America added AES Corp., (NYSE: AES) to its US-1 List. According to the bank, the US 1 list is the collection of the their best investment ideas that is subset of their buy-rated stocks. The bank has now removed Ameren (NYSE: AEE) from that list.

AES has had a huge run since May 11, 2020. It has risen from $11.87 on May 11 to $17.67 on August 17. That's a 49% gain in three months.  It may be wise to wait for a pull back before adding the stock to your portfolio.  A good entry point may be around $14.39. Currently, the money flow indicator is in overbought territory and the stock is hugging the upper part of the Bollinger Bands.  

Exhibit: AES Corp., has had a huge run 

 (Source: Tradingview)        

Disclosure: I do not own AES or Ameren

Sunday, August 16, 2020

Barron's Recommends Merck, But Is it a Buy At $83.

Barron's has recommended Merck (NYSE: MRK) stating that the company does not get "enough credit". Merck is currently trading at $83.48. The price is currently hugging the upper part of the Bollinger Band. The money flow indicator is approaching over-bought territory and currently sits at 60. The MACD is flashing a buy signal. All the moving averages are currently flashing a buy. If there's any pullback, the stock may be a buy at $75 or $76.  

Exhibit: Merck May Be a Buy at $75 or $76.

(Source: Tradingview)
 
Exhibit: Merck Moving Averages Are Indicating a Buy

 (Source: Tradingview)

Exhibit: Merck Oscillators


(Source: Tradingview)          

Large Insider Buy at Pfizer Made Me Look At that Stock

Barron's has reported that Pfizer's Director Ronald Blaylock has made the largest open-market purchase of the stock since 2003. Mr. Blaylock paid $510,000 on August 6th for 13,000 Pfizer (NYSE: PFE) shares. The Director has paid an average price of $38.53 for the shares. The stock has been trading lower and as of Friday, August 14, 2020, it was trading at $38.06. The money flow indicator is nearing oversold territory and the MACD is flashing a sell signal. A good entry point for the stock may be around $37.70. There seems to be support for the stock at this level. If the stock breaks below $37, another entry point would be around $32.50. The stock was at that level when the money flow indicator was in oversold territory on July 24, 2020.

Exhibit: Entry Points for Pfizer 


 (Source: Tradingview)           

Tuesday, August 11, 2020

Exited my position in Redfin and Energy Recovery

I had written about Energy Recovery Inc., (NASDAQ: ERII) on my blog on July 25, 2020. I had taken a small position in Energy Recovery on July 24, 2020 at $7.70. Since then the stock has had a nice run and I sold my position today at $8.50 for a 10.3% gain. The technical indicators are still flashing a buy for Energy Recovery. But the stock has had a sharp run-up. The MACD also had a bearish crossover and that was partly the reason for my sell. The Relative Strength Index was at 63 today and I did not wish for it be in the over bought territory before I sold this position. 

Exhibit: Energy Recovery Technical Indicators on August 11, 2020.

 (Source: Tradingview)

I took a position in Redfin on August 10, 2020 at a price of $41.80. I never had full conviction for this trade. I felt Redfin (NASDAQ: RDFN) was too overvalued and there were too many uncertainties in the economy and in the housing market. Given the loss of unemployment benefits for millions of Americans, I wasn't sure how this was going to impact the demand for housing. The Federal Reserve has done an admirable job of lowering the interest rates and stabilizing the financial markets. But even they cannot create jobs or pay unemployment benefits or prevent evictions. So, I felt that the economy is in a very precarious position.  In this current situation, I did not want own a company like Redfin. It may be a speculative bet at these valuations and economic conditions. I sold Redfin at $43.50 for total gain of 4%.   


Monday, August 10, 2020

A 6% return on Caterpillar in 6 days

I bought Caterpillar (NYSE: CAT) at $131.60 on August 4, 2020. I had visualized my trade in a previous blog post on this stock. I had placed a limit order at $139.97 or just below the $140. The limit got triggered today for a return of 6.3% in six days. My rational was that the stock could face some resistance just about $140 and wanted to exit my position at that level.  

Exhibit: Caterpillar trade set-up between August 4 and August 10, 2020 

 (Source: TradingView)   

Saturday, August 8, 2020

Why I bought Charles Schwab at $33.14 on Aug 7, 2020

Entry Price: $33.14

Trade Date: Aug 7, 2020

Potential Exit Points: Near the top of the Bollinger Bands at around 35.70 or wait until after the next earnings (October 19, 2020) and exit after collecting the dividend.  

Charles Schwab (NYSE: SCHW) is one of the largest brokerage firms in the country. A wave of consolidation across the industry is putting Schwab at a dominant position. In the near-term, Schwab faces pressure on its revenues due to the zero interest rate policy (ZIRP) of the Federal Reserve. The ZIRP is impacting Schwab's net interest margin, but it is having a positive impact on the number of trades executed. People everywhere are hungry for yield. Charles Schwab has also been successful in growing its asset base at a long-term growth rate of 6% due with its deft use of acquisitions to bolster assets.  The companies with the largest asset bases will survive and Schwab with $4 Trillion in assets will be one of those survivors. 

Exhibit: Schwab Growing New New Assets at around 6%

(Source: SeekingAlpha)

The consolidation in the industry will leave very few large players dominating the industry. Schwab recently acquired TD Ameritrade and Morgan Stanley acquired E*Trade. I am hoping to hold on to Schwab until after the next quarterly earnings and the dividend payment, which I anticipate would be a good one. 

From a technical analysis point of view, I am not fully convinced this is the perfect trade. The Simple Moving Averages are screaming a sell while some of the oscillators are signalling a buy. Overall the technical indicators are flashing a sell signal.  

Exhibit: Charles Schwab Technical Indicators - August 8, 2020 

(Source: Tradingview

The stock was trading near the lower price range of its Bollinger Bands and had a double bottom. That, along with the fundamentals, is what prompted me to buy the shares. 

Exhibit: Charles Schwab's Double Bottom

(Source: Tradingview

(Disclosure: I own Charles Schwab)


Wednesday, August 5, 2020

Disastrous Earnings at Dow Jones Industrial Average for the Latest Quarter

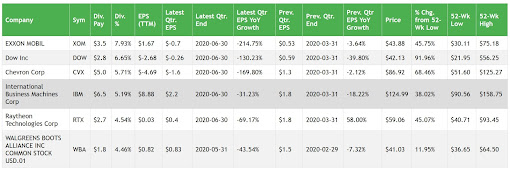
As of June 30, 2020, most of the companies in the Dow Jones Industrial Average (DJIA) have already reported quarterly earnings . The pandemic induced recession and the oil price war waged by Saudi Arabia and Russia have ravaged the earnings of the companies in the index. The first quartile EPS growth rate for the DJIA was a negative 68%.  The third quartile EPS growth was just 5%.

Exhibit: Latest Quarter EPS Growth Rate for Companies in the DJIA
(Source: SECURFII)
    
Exhibit: Gains from 52-Week Low for Companies in the DJIA
(Source: SECURFII)

Given this earnings back drop the stocks have done remarkably well. The first quartile gain for stocks in the DJIA from their 52-week low was 35%. The third quartile gain was 62%.
Exxon Mobil had the biggest drop in EPS going from $0.53 in the previous quarter to a negative $0.7 in the latest quarter that ended June 2020. 
In fact 20 out of their 30 companies in the DJIA recorded negative EPS growth rates.
 
Exhibit: Earnings of some of the companies in the DJIA
(Source: SECURFII)
 
(Disclosure: I own XOM, CVX, DOW, and others in the DJIA) 

Ford's New CEO Faces a Tough Road Ahead

On August 4, 2020 Ford (NYSE: F) announced that they are replacing Jim Hackett - the current CEO - with Jim Farley.  Farley was serving as the Chief Operating Officer at the company. Ford is getting ready to launch the new model for its iconic F-150. The F-150 is the best selling vehicle in the U.S. 

Exhibit: Ford is Launching a New Model of its Most Important Vehicle - The Ford F-150
(Source: SeekingAlpha)

Ford is also reviving its iconic Bronco brand in 2021. The new Bronco, I must admit looks absolutely stunning. 
Exhibit: The New Ford Bronco Line-up
(Source: Ford Website)
Ford is also making a huge commitment to electric vehicles. The company will have 15 electrified vehicle models available by end of the year. The competition in the electric vehicle market is heating up substantially with General Motors releasing a whole slew of vehicles and many other auto makers doing the same.

Exhibit: Ford is Launching New Electric Vehicles
(Source: SeekingAlpha)
Even before this pandemic induced economic crisis, Ford was not generating enough cash flow. It had a meager $0.5 billion in adjusted free cash flow in Q4 2019.
The challenge for Ford is that they were late to the electric car market and their upcoming models may not be differentiated enough. For example, their Escape plug-in hybrid model is advertised as having a 490 mile range. That would be a good range for a plug-in hybrid but there are many vehicle with that range. Given the upcoming competition in the the electric vehicle market will a model such as Escape plug-in hybrid stand out. 
They may have to do what Mary Barra at General Motors (GM) did years ago. She exited unprofitable markets such as Europe and India. Ford may have to exit unprofitable markets and bring their manufacturing capacity in-line with their sales and ensure they can stay profitable in a recession such as the one we are in now. 
Ford has a tough road ahead and in the interim the stock is going to continue under-performing.           

(Disclosure: I do not own Ford stock)
 

Tuesday, August 4, 2020

What is wrong with 3M?

I am going to break the suspense and answer the question in the title: "There's nothing wrong with 3M!" Its earnings for the quarter that ended June 2020 was exception given the tough circumstances under which every company in the world has been operating this year. Its GAAP EPS was $2.22 for Q2 2020 against an estimate of $1.80. Its revenue of $7.18 billion missed estimates by just $110 million. Complete industries in this era of the pandemic are in a free-fall and here we are punishing an essential, iconic American company for missing revenue by an amount, which would be 1.5% of the $7.18 billion.

Exhibit: 3M Q2 2020 Sales Declined by 13.1%

(Source: SeekingAlpha)

Yes, there was broad weakness in sales across all their business segments. But the company has been aggressive in reducing costs and was able to improve adjusted EBITDA margin by 110 basis points to 26.5%. Their operating cash flow increased 15% year-over-year to $1.9 billion. The management even paid down debt by $1.7 billion since the March 31, 2020 quarter.
The stock has been punished after the earnings. It has dropped from about $163 and trades a little over $151 as of August 4th. 

Exhibit: 3M Technical Indicators are Flashing a Strong Sell on August 4, 2020.

(Source: Tradingview)

Currently, the technical indicators are all flashing a strong sell signal. The market seems to be giving-up on 3M. But the Bollinger Bands are tightening and this raises the possibility of a sharp price move in either direction. Given that the other technical signals are flashing sell, tightening Bollinger Bands could indicate a drop from this level.

Exhibit: 3M Bollinger Bands are Tightening.

(Source: Tradingview)

(Disclosure: I do not own 3M)


Caterpillar May be a Buy at around $131

Caterpillar (CAT) may be signalling a buy at around $131. This could be short term trade and the exit could be around $140, where the stock could face resistance. Bollinger Bands indicate that the stock is relatively cheap at around $131. There was a 30% upside on reported earnings compared to Wall Street estimates. EPS on Jul 31, 2020 was $0.84 compared to estimate of $0.64.  The earning beat indicate that the stock can go higher in the short-term. 

Exhibit: CAT's SMA is mostly bullish and Bollinger Bands indicate relative low prices.

(Source: Tradingview)
(Disclosure: I own CAT)   

Monday, August 3, 2020

Boeing has broken below a key support level

Boeing missed earnings targets by a huge margin on June 29, 2020. One Wall Street analyst called it a "planewreck"! The company reported a loss of $4.20 when the Wall Street estimate was for a loss of $2.55. This huge miss is driving the stock even lower. I have done a brief technical analysis of Boeing's 3-month chart and it does not paint a pretty picture.  The stock dropped below key support level of around $169. Today's small rally in the stock that brought it to $162 may be a false one and Boeing may continue dropping. 


(Source: TradingView)


(Disclosure: I own Boeing)

Saturday, August 1, 2020

Caterpillar May be Set to Weaken Further.

Caterpillar recently announced that it may face a prolonged sales decline. The stock lost considerable ground on the day of this news. Looking at the Caterpillar's chart, it seems like weakness is set to continue. Caterpillar's sales have declined by 30% in Q2 2020. That's a very substantial decline. Given that the company sells very high-priced capital equipment that last a long time, demand for this equipment may recover slowly.

Exhibit: Caterpillar's Sales Were Down 30% Compared To Q2 2019.


(Source: SeekingAlpha)

I have also done a trend analysis on TradingView that seem to indicate further weakness to come in the stock.  

Exhibit: Caterpillar's chart is reflecting its weak fundamental. 

Morningstar's analyst report on July 31 2020 makes a couple of interesting points:
  • Many end markets served by the company are not directly affected. 
  • Given the rally in gold, that may spur more mining.
All this may not be enough to save the company from a prolonged downturn. 


Wednesday, July 29, 2020

Big Tech is Taking a Break From the Rally

    Both Apple (AAPL) and Microsoft (MSFT) are trading below its 10-day moving average. Apple is down from its 52-week high of $399.82 and currently trades at $380.16. That's a drop from the 52-week high of - 4.97%. Apple's 10-day moving average is 382.436 (Tuesday, July 28, 2020). Microsoft is down from $216.38 to $204.06 that's a -5.6% change. Its 10-day moving average is $202.15. Amazon (AMZN), Facebook (FB), and Alphabet (GOOG) are all trading below their 10-day moving average. Out of this cohort only Facebook is trading below its 50-day moving average. 

Exhibit: Big Tech's Downturn has Started. When will it end? 


(Source: SECURFII)


    Microsoft has gained 53% from its lows in March 2020. Apple has gained 76% form its March 2020 lows.  The gains have been spectacular. Google has gained 50% from its March lows. Amazon has gained nearly 82% from its March 2020 lows.     

    It seems like all these stocks are starting a downward trend after the huge run-up they have had over the last few years and the rebound they have had since the pandemic induced crash of March 2020.           

Tuesday, July 28, 2020

Boeing Lost Support at 50-Day Moving Average In a Bearish Sign For the Stock

Boeing has lost support at the 50-day moving average. This is a bearish sign for the stock.

Exhibit: Boeing's Simple Moving Average (Data based on Monday, July 27, 2020)


(Source: Secure Your Financial Independence - DJIA SMA Report)

Boeing is currently trading at $169.26. There seems to be support at this level. If it loses support here, then Boeing may drop all the way to $120 for the next support level.  Given the bad news at Boeing, it is entirely possible that it will touch $120 in the coming weeks or months. 

Exhibit: Boeing Has Support at $169. If it loses this support, it may drop all the way to $120. 


(Source: SeekingAlpha & Author Annotations)

    Boeing recently announced that it will delay its 777x jet by up to an year. Even before the pandemic, Boeing was dealing with the problems with its 737 Max jets. When the pandemic hit, it grounded the entire travel industry. It now seems like it may take years before the travel industry can fully recover. It may take a couple of years after travel gets back to 2019 level that Boeing will start to get new orders for jets. There's so much excess inventory of jets across the globe that airlines may put off buying new jets for years. Combine this with the problem of airlines going bankrupt and you have lesser number of customers to chase for new jet orders.  Given all these factors, it's entirely plausible that Boeing's stock could give-up much of its gain since May 2020 and retrace to $120. If it loses support at $120, it may test its lows below $100.
    This crisis is a real test of leadership. Boeing is such an iconic company that it's painful to see this downfall. I am confident that in 3-5 years Boeing will be in much better shape.
(Disclosure: I own Boeing)        


Tuesday, July 21, 2020

Visa, Home Depot, and Nike are a Buy Based on Simple Moving Average

    Home Depot (HD), Visa (V), and Nike (NKE) are buys at these levels when you consider only the 50-Day and 200-Day simple moving averages of all the stocks in the Dow Jones Industrial Average. Nike's 50-day simple moving average (SMA) is greater than its 200-day SMA. That's considered a bullish signal for the stock. Its 10-day SMA is greater than both its 50-day and 200-day. Both Visa and Home Depot exhibit the Golden Cross pattern where the 50-day SMA exceeds the 200-day SMA. But, based on fundamentals are they too expensive? 

Exhibit: Simple Moving Average May be Indicating that Nike is Buy
    

(Source: Securfii)

Exhibit: Simple Moving Average May be Indicating that Home Depot and Visa are a Buy


(Source: Securfii)

Nike is currently trading at 40x forward earnings. Home Depot is trading at 25x forward earnings and Visa is trading at 39x forward earnings. From a fundamental perspective all three companies are trading at a premium. But, on the other hand all three companies are one-of-a-kind in the world. Nike has an incomparable brand that is cherished across the globe. Visa has global network effects that cannot be easily replicated.  Home Depot's biggest strength may be its operational excellence.
Disclosure: I do not currently own HD, V, and NKE.


Paccar: Peak Demand For Trucks

 Paccar ( PCAR ) produced 185,900 trucks in 2022 and is on track for another record year in 2023. The company has experienced good revenue ...