Showing posts with label DJIA. Show all posts

Friday, May 7, 2021

Does data prove that the "low" jobs additions in April '21 is due to extended unemployment benefits?

 The U.S. Chamber of Commerce tweeted that the extended unemployment benefits should be stopped given the "low" number of job additions during April 2021.

There's lot of chatter that people are getting more in unemployment benefits and that's keeping them from taking a job. April saw addition of 266,000 jobs. In a normal economy, 266,000 jobs would be a very good report. There could be multiple reasons for why the jobs report came in well below the expectation of a 1 million jobs. 

  • Many parents still have kids who are remote learning. So, they may not have the flexibility to take-up employment while they are caring for their kids.    
  • Vaccines were only widely available in the middle of April. So, people who were waiting to get vaccinated before heading to work, can only now get fully vaccinated.  
The best response to US Chamber of Commerce was provided by Ben Zipperer:         

Monday, August 10, 2020

A 6% return on Caterpillar in 6 days

I bought Caterpillar (NYSE: CAT) at $131.60 on August 4, 2020. I had visualized my trade in a previous blog post on this stock. I had placed a limit order at $139.97 or just below the $140. The limit got triggered today for a return of 6.3% in six days. My rational was that the stock could face some resistance just about $140 and wanted to exit my position at that level.  

Exhibit: Caterpillar trade set-up between August 4 and August 10, 2020 

 (Source: TradingView)   

Wednesday, August 5, 2020

Disastrous Earnings at Dow Jones Industrial Average for the Latest Quarter

As of June 30, 2020, most of the companies in the Dow Jones Industrial Average (DJIA) have already reported quarterly earnings . The pandemic induced recession and the oil price war waged by Saudi Arabia and Russia have ravaged the earnings of the companies in the index. The first quartile EPS growth rate for the DJIA was a negative 68%.  The third quartile EPS growth was just 5%.

Exhibit: Latest Quarter EPS Growth Rate for Companies in the DJIA
(Source: SECURFII)
    
Exhibit: Gains from 52-Week Low for Companies in the DJIA
(Source: SECURFII)

Given this earnings back drop the stocks have done remarkably well. The first quartile gain for stocks in the DJIA from their 52-week low was 35%. The third quartile gain was 62%.
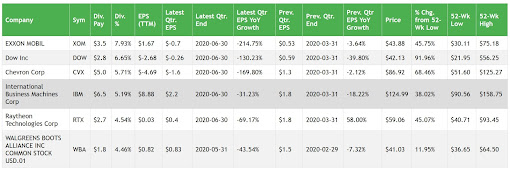
Exxon Mobil had the biggest drop in EPS going from $0.53 in the previous quarter to a negative $0.7 in the latest quarter that ended June 2020. 
In fact 20 out of their 30 companies in the DJIA recorded negative EPS growth rates.
 
Exhibit: Earnings of some of the companies in the DJIA
(Source: SECURFII)
 
(Disclosure: I own XOM, CVX, DOW, and others in the DJIA) 

Ford's New CEO Faces a Tough Road Ahead

On August 4, 2020 Ford (NYSE: F) announced that they are replacing Jim Hackett - the current CEO - with Jim Farley.  Farley was serving as the Chief Operating Officer at the company. Ford is getting ready to launch the new model for its iconic F-150. The F-150 is the best selling vehicle in the U.S. 

Exhibit: Ford is Launching a New Model of its Most Important Vehicle - The Ford F-150
(Source: SeekingAlpha)

Ford is also reviving its iconic Bronco brand in 2021. The new Bronco, I must admit looks absolutely stunning. 
Exhibit: The New Ford Bronco Line-up
(Source: Ford Website)
Ford is also making a huge commitment to electric vehicles. The company will have 15 electrified vehicle models available by end of the year. The competition in the electric vehicle market is heating up substantially with General Motors releasing a whole slew of vehicles and many other auto makers doing the same.

Exhibit: Ford is Launching New Electric Vehicles
(Source: SeekingAlpha)
Even before this pandemic induced economic crisis, Ford was not generating enough cash flow. It had a meager $0.5 billion in adjusted free cash flow in Q4 2019.
The challenge for Ford is that they were late to the electric car market and their upcoming models may not be differentiated enough. For example, their Escape plug-in hybrid model is advertised as having a 490 mile range. That would be a good range for a plug-in hybrid but there are many vehicle with that range. Given the upcoming competition in the the electric vehicle market will a model such as Escape plug-in hybrid stand out. 
They may have to do what Mary Barra at General Motors (GM) did years ago. She exited unprofitable markets such as Europe and India. Ford may have to exit unprofitable markets and bring their manufacturing capacity in-line with their sales and ensure they can stay profitable in a recession such as the one we are in now. 
Ford has a tough road ahead and in the interim the stock is going to continue under-performing.           

(Disclosure: I do not own Ford stock)
 

Tuesday, August 4, 2020

Caterpillar May be a Buy at around $131

Caterpillar (CAT) may be signalling a buy at around $131. This could be short term trade and the exit could be around $140, where the stock could face resistance. Bollinger Bands indicate that the stock is relatively cheap at around $131. There was a 30% upside on reported earnings compared to Wall Street estimates. EPS on Jul 31, 2020 was $0.84 compared to estimate of $0.64.  The earning beat indicate that the stock can go higher in the short-term. 

Exhibit: CAT's SMA is mostly bullish and Bollinger Bands indicate relative low prices.

(Source: Tradingview)
(Disclosure: I own CAT)   

Monday, August 3, 2020

Boeing has broken below a key support level

Boeing missed earnings targets by a huge margin on June 29, 2020. One Wall Street analyst called it a "planewreck"! The company reported a loss of $4.20 when the Wall Street estimate was for a loss of $2.55. This huge miss is driving the stock even lower. I have done a brief technical analysis of Boeing's 3-month chart and it does not paint a pretty picture.  The stock dropped below key support level of around $169. Today's small rally in the stock that brought it to $162 may be a false one and Boeing may continue dropping. 


(Source: TradingView)


(Disclosure: I own Boeing)

Saturday, August 1, 2020

Caterpillar May be Set to Weaken Further.

Caterpillar recently announced that it may face a prolonged sales decline. The stock lost considerable ground on the day of this news. Looking at the Caterpillar's chart, it seems like weakness is set to continue. Caterpillar's sales have declined by 30% in Q2 2020. That's a very substantial decline. Given that the company sells very high-priced capital equipment that last a long time, demand for this equipment may recover slowly.

Exhibit: Caterpillar's Sales Were Down 30% Compared To Q2 2019.


(Source: SeekingAlpha)

I have also done a trend analysis on TradingView that seem to indicate further weakness to come in the stock.  

Exhibit: Caterpillar's chart is reflecting its weak fundamental. 

Morningstar's analyst report on July 31 2020 makes a couple of interesting points:
  • Many end markets served by the company are not directly affected. 
  • Given the rally in gold, that may spur more mining.
All this may not be enough to save the company from a prolonged downturn. 


Wednesday, July 29, 2020

Big Tech is Taking a Break From the Rally

    Both Apple (AAPL) and Microsoft (MSFT) are trading below its 10-day moving average. Apple is down from its 52-week high of $399.82 and currently trades at $380.16. That's a drop from the 52-week high of - 4.97%. Apple's 10-day moving average is 382.436 (Tuesday, July 28, 2020). Microsoft is down from $216.38 to $204.06 that's a -5.6% change. Its 10-day moving average is $202.15. Amazon (AMZN), Facebook (FB), and Alphabet (GOOG) are all trading below their 10-day moving average. Out of this cohort only Facebook is trading below its 50-day moving average. 

Exhibit: Big Tech's Downturn has Started. When will it end? 


(Source: SECURFII)


    Microsoft has gained 53% from its lows in March 2020. Apple has gained 76% form its March 2020 lows.  The gains have been spectacular. Google has gained 50% from its March lows. Amazon has gained nearly 82% from its March 2020 lows.     

    It seems like all these stocks are starting a downward trend after the huge run-up they have had over the last few years and the rebound they have had since the pandemic induced crash of March 2020.           

Tuesday, July 28, 2020

Boeing Lost Support at 50-Day Moving Average In a Bearish Sign For the Stock

Boeing has lost support at the 50-day moving average. This is a bearish sign for the stock.

Exhibit: Boeing's Simple Moving Average (Data based on Monday, July 27, 2020)


(Source: Secure Your Financial Independence - DJIA SMA Report)

Boeing is currently trading at $169.26. There seems to be support at this level. If it loses support here, then Boeing may drop all the way to $120 for the next support level.  Given the bad news at Boeing, it is entirely possible that it will touch $120 in the coming weeks or months. 

Exhibit: Boeing Has Support at $169. If it loses this support, it may drop all the way to $120. 


(Source: SeekingAlpha & Author Annotations)

    Boeing recently announced that it will delay its 777x jet by up to an year. Even before the pandemic, Boeing was dealing with the problems with its 737 Max jets. When the pandemic hit, it grounded the entire travel industry. It now seems like it may take years before the travel industry can fully recover. It may take a couple of years after travel gets back to 2019 level that Boeing will start to get new orders for jets. There's so much excess inventory of jets across the globe that airlines may put off buying new jets for years. Combine this with the problem of airlines going bankrupt and you have lesser number of customers to chase for new jet orders.  Given all these factors, it's entirely plausible that Boeing's stock could give-up much of its gain since May 2020 and retrace to $120. If it loses support at $120, it may test its lows below $100.
    This crisis is a real test of leadership. Boeing is such an iconic company that it's painful to see this downfall. I am confident that in 3-5 years Boeing will be in much better shape.
(Disclosure: I own Boeing)        


Saturday, July 25, 2020

Climate Change Mitigation Technologies Will be Winners in the Future

    For all the efforts that are underway across the globe to keep the earth's temperature from rising, one thing is becoming clearer with each passing day - climate change mitigation technologies and projects will have to be employed at a large scale to tackle its effects. Companies in the climate mitigation space should be on the radar for investors. 
    I have come to this conclusion after reading various articles on the topic of climate change over a number of years. A couple of recent articles in the New York Times only got be thinking more seriously about the kind of climate change mitigation technologies that will be winners in the future. One article discusses the crisis that could be brought on by the mass migration of people due to excessive heat caused by climate change. When excessive heat causes drought, destroys crops, and makes living conditions very hard, people may have no choice than to start migrating towards cities and seek refuge there.
    Various technologies may have to be employed to prevent farmers from dying of hunger and excessive heat. Providing people with air conditioned spaces could be one of the mitigation project that could be more broadly applied. Air conditioner makers such as Carrier (NYSE: CARR) may be a big beneficiaries of this trend. Use of air conditioners increases the global warming and those effects need to be mitigated too.
    To mitigate the effects of drought, more desalination plants will have to be built to supply growing cities with water.  These plants can also be used to supply water for irrigation. Israel is a leader in the use of desalination technology and it's just a matter of time before many other parts of the world - like India, Africa, the United States, and South America - need massive desalination capabilities. These plants are primarily based on seawater reverse osmosis (SWRO) technology. The reverse osmosis plants consume a lot of energy. To reduce energy use, these plants employ energy recovery devices such as the one manufactured by Energy Recovery Inc (NASDAQ: ERII).

Exhibit: A Energy Recovery Device Built by Energy Recovery Inc.


(Source: Energy Recovery Inc.)
   
    Other technologies and projects that will gain wide spread use in the future are vertical or indoor farming and drip irrigation systems. A lot of venture capital investment is going into vertical farming companies. Softbank has invested in an indoor farming start-up called Plenty. While investors focus on high-tech startups like Plenty, they should not lose focus of "old school" technology such as water pumps, drip irrigation systems and water meters that could also see increasing demand in the years to come. Water conservation technologies beyond drip irrigation will gain ground. For example, low-flush toilets could gain wide-spread use in households. Sophisticated leak detection systems could be employed at a much wider scale to prevent water loss in the water distribution networks and at home. 
    As the world tackles climate change, investors should keep a close eye on mitigation technologies that could improve lives.  
(Disclosure: I own shares in Energy Recovery Inc.) 


Tuesday, July 21, 2020

Visa, Home Depot, and Nike are a Buy Based on Simple Moving Average

    Home Depot (HD), Visa (V), and Nike (NKE) are buys at these levels when you consider only the 50-Day and 200-Day simple moving averages of all the stocks in the Dow Jones Industrial Average. Nike's 50-day simple moving average (SMA) is greater than its 200-day SMA. That's considered a bullish signal for the stock. Its 10-day SMA is greater than both its 50-day and 200-day. Both Visa and Home Depot exhibit the Golden Cross pattern where the 50-day SMA exceeds the 200-day SMA. But, based on fundamentals are they too expensive? 

Exhibit: Simple Moving Average May be Indicating that Nike is Buy
    

(Source: Securfii)

Exhibit: Simple Moving Average May be Indicating that Home Depot and Visa are a Buy


(Source: Securfii)

Nike is currently trading at 40x forward earnings. Home Depot is trading at 25x forward earnings and Visa is trading at 39x forward earnings. From a fundamental perspective all three companies are trading at a premium. But, on the other hand all three companies are one-of-a-kind in the world. Nike has an incomparable brand that is cherished across the globe. Visa has global network effects that cannot be easily replicated.  Home Depot's biggest strength may be its operational excellence.
Disclosure: I do not currently own HD, V, and NKE.


Monday, July 20, 2020

Goldman Sachs Looks Attractive Based on Moving Averages and Q2 Results

    The Goldman Sachs (NYSE: GS) is on the move - both the company and the stock. As of July 20th, 2020, the stock is currently trading above its 10-day, 50-day, 100-day, and 200-day moving averages. Even thought the 50-day moving average is below the 200-day moving average, I believe it's just a matter of time when the 50-day moving average crosses the 200-day moving average. On top of that the company reported blockbuster earnings in Q2, FY 2020. The company reported its second highest quarterly net revenue in its history. Revenues were up 41% compared to Q2 FY 2019.

Exhibit: Goldman Sachs Q2 FY 2020 Results Snapshot


(Source: SeekingAlpha)

Exhibit: Goldman Sachs Revenue Grew by 41% in Q2 FY 2020

(Source: SeekingAlpha)

    Goldman Sachs has been busy launching new products and services bringing innovation to the field. They have launched a new cloud-based transaction banking service that would bring modern treasury services and working capital management for customers worldwide. They have also launched a new buyout fund.      

Exhibit: Moving Averages for Goldman Sachs is Bullish     


(Source: SECURFII)

Disclosure: I own Goldman Sachs.

Sunday, July 19, 2020

Simple Moving Average of All 30 Stocks in the Dow Jones Industrial Average

    Moving averages can be powerful momentum indicator for stock price movements. The simple moving average provides a way to find attractive entry points for stock. For example, the golden cross is a bullish signal for a stock when its short-term moving average breaks above a long-term one. For example, when a 50-day moving average crosses above the 200-day moving average. I have created a website that generates the simple moving average of all stocks in the Dow Jones Industrial Average.  This report will be generated daily after market close and can help you get ready for the next trading day. This report generates the 10-Day, 50-Day, 100-Day, 200-Day moving average of stocks in the DJIA.  It also compares the moving average price against the last price of that stock.  This gives you a perspective on where the last stock price stands in relationship to the moving averages.
                   Exhibit: Sample of the Simple Moving Average Report 

(Source: securfii.com)


Tuesday, July 7, 2020

Warren Buffett Bought a Gas Pipeline and an U.S. Judge may have made it a Winning Investment

    Since March, 2020 when the COVID-19 pandemic drove the U.S. and the globe into a recession and tanked markets worldwide, there has been speculation about what Warren Buffet would be buying given the bargains. In March the Dow Jones Industrial Average (DJIA) dropped from an all-time high of 29,551 to 18,591. Many stock watchers and TV pundits speculated that this is the time when Warren Buffett would see value in stocks and put his company's sizeable cash to work.

Exhibit: Dow Jones Industrial Average (DJIA) One-Year Performance


(Source: Google Finance)

    It has now become clear that Warren Buffett and his partner Charlie Munger were looking to strike a few deals at bargain prices, but the intervention by the U.S. Federal Reserve in March made it very easy for companies in all sorts of fiscal shape could easily raise billions of dollars.
    Finally in July 2020 Warren and Charlie did strike a deal. They invested $10 billion in buying the natural gas pipeline assets of Dominion Energy. When almost every investor is shying away from investing in fossil fuel assets, Berkshire Hathaway sees value in it. It's going to take a long time for the world to move away from fossil fuels.
    The past week has produced some stark headlines about the energy business. The Financial Times reported that BP was marking down the value of its oil and natural gas assets by $17.5 billion. Under the shadows of the stress that the oil business is in, Berkshire Hathaway makes a contrarian bet. Then came another headline, this time from a Federal District court. The court ruled that work on the Dakota Access Pipeline will have to stop until a comprehensive environmental review is completed.
    Even before this decision, building anything related to the oil and gas industry in the U.S was an herculean task. This decision makes it harder. It is now assured that the work on this pipeline will not proceed until after the U.S. election. If Joe Biden is elected president then this pipeline may never get built.  So, any oil and gas asset already in existence in the U.S. have just been elevated in value. This deal by Berkshire Hathaway has the potential to offer profitable returns for the company. 

Disclosure: I own shares in Berkshire Hathaway and BP.       


Friday, July 3, 2020

Among DJIA Stocks Procter & Gamble had a Stellar Quarter, Yet its Stock Underperformed others on the DJIA

    As of July 2, 2020 the median year-over-year (YoY) EPS growth (March, 2020 Quarter) for a stock in the Dow Jones Industrial Average (DJIA) was a negative 3.39%. But the median gain for a stock on the DJIA from its 52-week low was 43%.

Exhibit: Procter & Gamble Brands

(Source: P&G Website)

    Procter & Gamble (PG) a member of the DJIA had a stellar March quarter. Its EPS grew by 10.3% YoY. This put Procter & Gamble's performance in the fourth quartile. Yet, its gain from 52-week low was just 28% as of July 2, 2020 putting it in the first quartile of gains. Why is there such a disparity in stock performance for a proven stellar company?
  
Exhibit: Dow Jone Industrial Average (DJIA) March, 2020 Quarter EPS Growth & Gains from 52-Week Low


(Source: SECURFII.COM - Data as of July 3, 2020)

    In this era of extreme uncertainty in the economy due to the pandemic, Procter & Gamble is one of the very few companies still providing annual earnings guidance. They are also a rare company that is still maintaining and increasing their dividends and continuing their share repurchase. I am not a fan of share repurchases since it seems to mostly benefit a company's management to achieve its EPS goals rather than being a true return of money to the shareholders. But, if share repurchases are done at the right (lower) price compared to the fair market valuation of the company, it could be a huge boost to the shareholders. 
    The company is expecting to pay over $7.5 billion in dividends and repurchase $7 billion to $8 billion in shares in fiscal 2020. Over the three quarters in fiscal 2020, Procter & Gamble has seen organic sales growth averaging about 6% when the GDP growth for the world has turned negative the first-half of 2020.
    The company is richly valued at about 24x earnings. That may be the reason why its stock gains are not in par with the rest of the stocks in the DJIA. But some of the companies, like Boeing, have had a disastrous fall in sales. Boeing will continue to hurt for multiple quarters or even years to come as airline traffic recovers slowly. If there's a pull back in the stock, Procter & Gamble would a great addition to a portfolio.   
Disclosure: At the time of this publication, I do not own PG stock. 
                  

Wednesday, July 1, 2020

How did the U.S. Markets have the Best Quarter in Decades?

    The quarter that ended on Tuesday, June 30th was the best quarter for the market in two decades. How did the U.S. stock market end with such a statistic in the midst of a global pandemic and record unemployment?
    On February 12th, 2020, the Dow Jones Industrial Average (DJIA) had hit an all-time high of 29,551. But by February 21st, 2020, the fear that the COVID-19 virus is going to bring life to a standstill in the U.S was taking hold in the market. The markets were in free-fall from around that time until March 23, 2020. On this date the Dow Jones Industrial Average was at 18,591. It was a drop of about 37% from the top.
                             Exhibit: Dow Jones Industrial Average hit bottom on March 23, 2020
                                            (Source: Google Finance)
    March 23 would end-up being a monumental date for the country as a whole and a one for the history books. This was the date on which the Federal Reserve made an announcement that they are "committed to using its full range of tools to support households, businesses, and the U.S. economy overall in this challenging time."
    This announcement was interpreted by the markets that the U.S. Federal Reserve is going to provide a backstop to the losses mounting across companies of all different sizes. The demand for products and services provided by airlines, restaurants, cruises, and malls vanished overnight. Most of these companies did not have a plan or funds in place for such a dramatic drop-off in demand. The Federal Reserve did not want to see problems in one sector of the economy, mainly in discretionary spending, spillover into other sectors. For example, when fear of COVID-19 took over and many states instituted lock downs or quarantine orders, malls and restaurants were forced to close their doors. That in turn led to these companies not generating any revenues that could be used to pay their bills, such as paying their rent or their suppliers. This cascading effect would lead to companies, cities, and states all across the U.S. laying off millions of people and plunging the U.S. into another great depression
    The Federal Reserve started buying high-quality assets in the open market along with making billions of dollars of loans available to companies of all sizes. Even though millions of people still lost their jobs, an argument could be made that this move by the Federal Reserve did prevent a great catastrophe. Without the bold intervention of the Federal Reserve, a worldwide health crisis could have easily grown exponentially larger when a worldwide economic crisis is unleashed at the same time.
    So, it turns out March 23 was the day the U.S. markets hits bottom. An epic stock market rally started that day and by June 30, 2020, the Dow Jones Industrial Average had gained about 38% from its bottom of 18,591. The DJIA stood at 25,812 on June 30, 2020.             

Impact of GenAI on R&D Expenditure

 Summary: Describe the AI money flow using an illustration. How much do Adobe, Salesforce, and others spend on Research and Development (R&a...