The Chemours Company is a diversified chemical company serving multiple industries. Here are its products:
Exhibit 1:

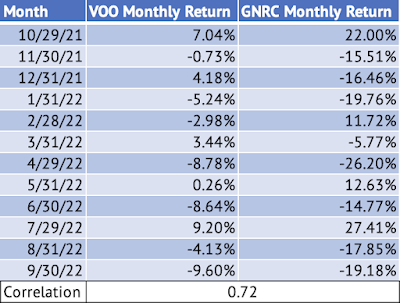
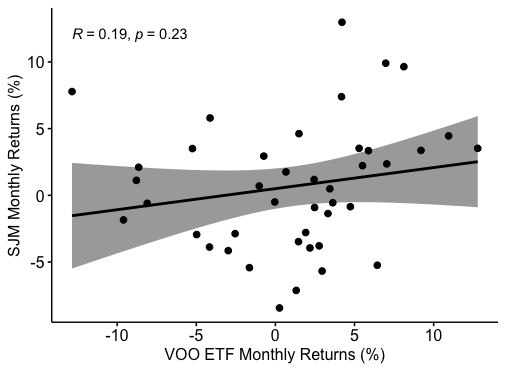
Here's the graph of the monthly returns of the Vanguard S&P 500 Index ETF and the Chemours Company:
Exhibit 2:
 |
| Source: Data Provided by IEX Cloud, Graph Created Using Microsoft Excel and RStudio |
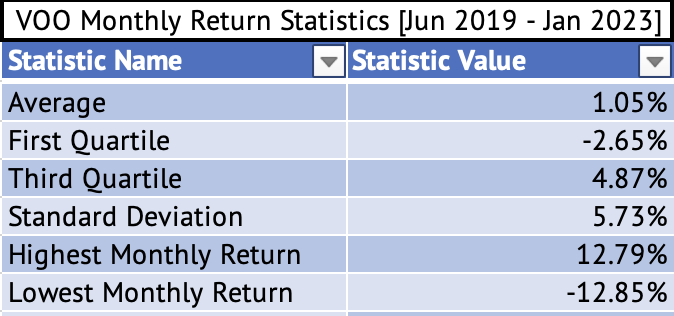
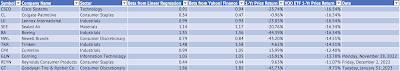
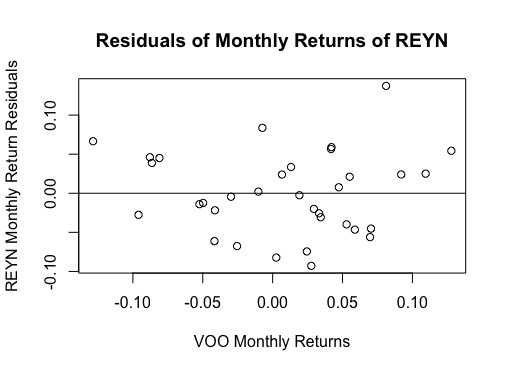
Exhibit 3:
 |
| Source: Data Provided by IEX Cloud, Calculated Using Microsoft Excel |
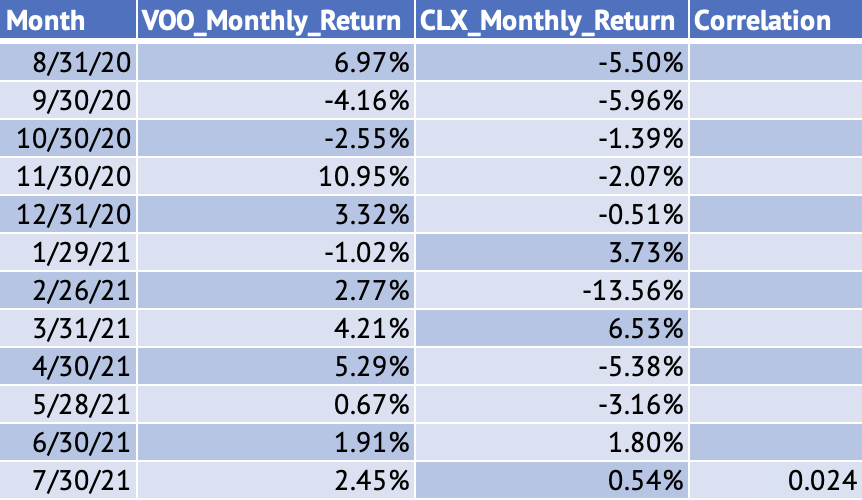
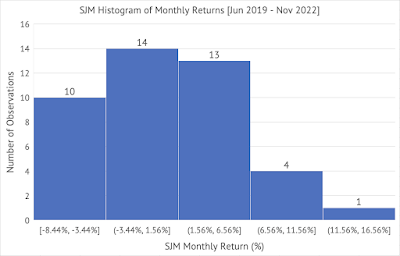
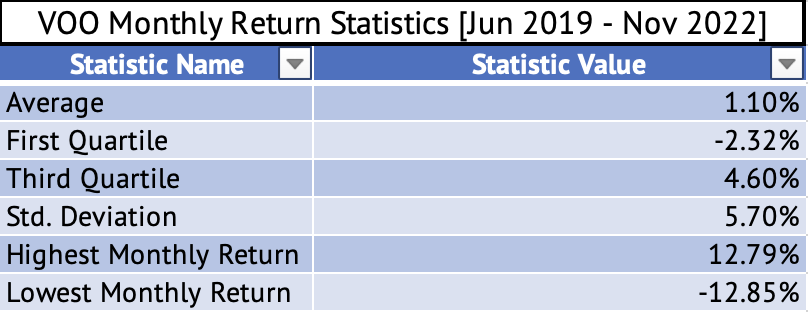
Exhibit 4:
 |
| Source: Data Provided by IEX Cloud, Calculated Using Microsoft Excel |
Here's the output from the linear model:
Call:
lm(formula = CC_Monthly_Return ~ VOO_Monthly_Return, data = VOOandCC)
Residuals:
Min 1Q Median 3Q Max
-0.23930 -0.07880 0.01016 0.07621 0.29157
Coefficients:
Estimate Std. Error t value Pr(>|t|)
(Intercept) 0.006698 0.018764 0.357 0.723
VOO_Monthly_Return 1.825643 0.325520 5.608 1.45e-06 ***
---
Signif. codes: 0 ‘***’ 0.001 ‘**’ 0.01 ‘*’ 0.05 ‘.’ 0.1 ‘ ’ 1
Residual standard error: 0.1224 on 42 degrees of freedom
Multiple R-squared: 0.4282, Adjusted R-squared: 0.4146
F-statistic: 31.45 on 1 and 42 DF, p-value: 1.45e-06
The stock had a great January 2023 with a return of 18% compared to a 6.2% return of the Vanguard S&P 500 Index ETF.
Here's the chart of the monthly returns of the Vanguard S&P 500 Index and the Chemours Company:
Exhibit 5:
 |
| Source: Data Provided by IEX Cloud, Calculated Using Microsoft Excel |