Generac Holdings (GNRC) has a beta of 1.19 based on a linear regression model of the monthly returns of the Vanguard S&P 500 Index ETF (VOO) and Generac Holdings. The company's residential sales slowdown has pushed the stock lower over the past five months. The stock has dropped 55% compared to a 7% drop for the Vanguard S&P 500 Index ETF over the past year. This massive underperformance of the stock has led to a drop in the monthly return correlation of the Vanguard ETF and Generac Holdings.
Exhibit 1: A Generac Generator
 |
| Source: Generac Holdings Inc. |
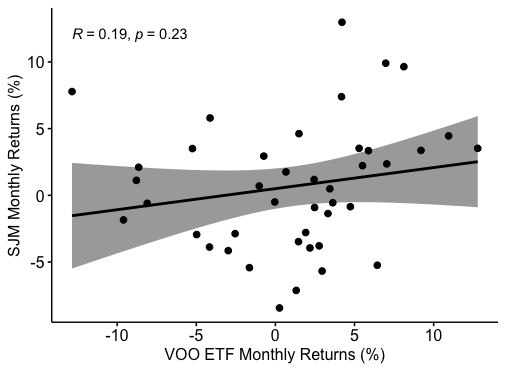
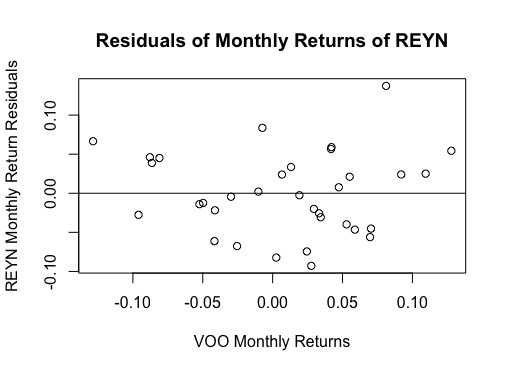
Exhibit 2: Monthly Returns of the Vanguard S&P 500 Index ETF and Generac Holdings
 |
| Source: Data Provided by IEX Cloud, Author Calculations on Microsoft Excel, Graph Created on RStudio |
The graph of the monthly returns also shows a correlation of 0.44 between the two equities.
Here are the betas of some of the stocks I have covered over the past few months (Exhibit 3).
Note: Click on each image to see an enlarged version.
Exhibit 3: Beta of Various stocks in the consumer staples, consumer discretionary, and industrial sectors.
 |
| Source: Data Provided by IEX Cloud, Author Calculations using Microsoft Excel and RStudio |
Here's the output from the linear regression model:
Call:
lm(formula = GNRC_Monthly_Return ~ VOO_Monthly_Return, data = VOOandGNRC)
Residuals:
Min 1Q Median 3Q Max
-0.46400 -0.09209 0.00221 0.10001 0.28690
Coefficients:
Estimate Std. Error t value Pr(>|t|)
(Intercept) 0.01733 0.02170 0.798 0.42915
VOO_Monthly_Return 1.19915 0.37646 3.185 0.00273 **
---
Signif. codes: 0 ‘***’ 0.001 ‘**’ 0.01 ‘*’ 0.05 ‘.’ 0.1 ‘ ’ 1
Residual standard error: 0.1415 on 42 degrees of freedom
Multiple R-squared: 0.1946, Adjusted R-squared: 0.1754
F-statistic: 10.15 on 1 and 42 DF, p-value: 0.002726
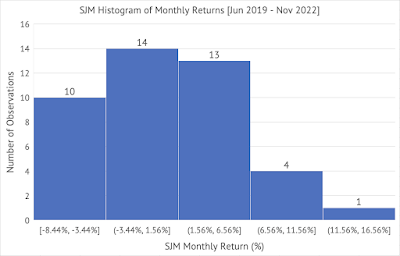
The monthly return statistics for Generac holdings show that the stock has a very high standard deviation of 15% in its monthly returns (Exhibit 4).
Exhibit 4: Generac Holdings Monthly Return Statistics [June 2019 - January 2023]
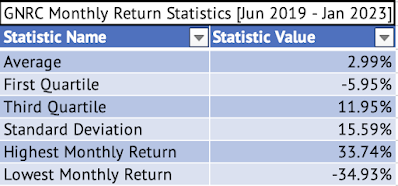 |
| Source: Data Provided by IEX Cloud, Author Calculations Using Microsoft Excel |
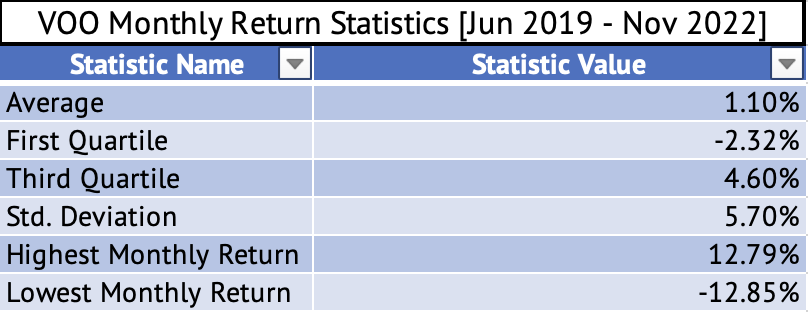
Here are the return statistics for the Vanguard S&P 500 Index ETF during the same period (Exhibit 5).
Exhibit 5: Vanguard S&P 500 Index ETF Monthly Return Statistics [June 2019 - January 2023]
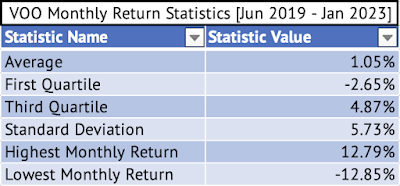 |
Source: Data Provided by IEX Cloud, Author Calculations Using Microsoft Excel |
Exhibit 6: Monthly Return Correlation of the Vanguard S&P 500 Index ETF and Generac Holdings
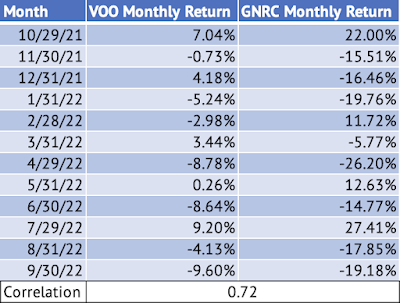 |
| Source: Data Provided by IEX Cloud, Author Calculations Using Microsoft Excel and RStudio |