Showing posts with label Simple Moving Average. Show all posts

Saturday, August 8, 2020

Why I bought Charles Schwab at $33.14 on Aug 7, 2020

Entry Price: $33.14

Trade Date: Aug 7, 2020

Potential Exit Points: Near the top of the Bollinger Bands at around 35.70 or wait until after the next earnings (October 19, 2020) and exit after collecting the dividend.  

Charles Schwab (NYSE: SCHW) is one of the largest brokerage firms in the country. A wave of consolidation across the industry is putting Schwab at a dominant position. In the near-term, Schwab faces pressure on its revenues due to the zero interest rate policy (ZIRP) of the Federal Reserve. The ZIRP is impacting Schwab's net interest margin, but it is having a positive impact on the number of trades executed. People everywhere are hungry for yield. Charles Schwab has also been successful in growing its asset base at a long-term growth rate of 6% due with its deft use of acquisitions to bolster assets.  The companies with the largest asset bases will survive and Schwab with $4 Trillion in assets will be one of those survivors. 

Exhibit: Schwab Growing New New Assets at around 6%

(Source: SeekingAlpha)

The consolidation in the industry will leave very few large players dominating the industry. Schwab recently acquired TD Ameritrade and Morgan Stanley acquired E*Trade. I am hoping to hold on to Schwab until after the next quarterly earnings and the dividend payment, which I anticipate would be a good one. 

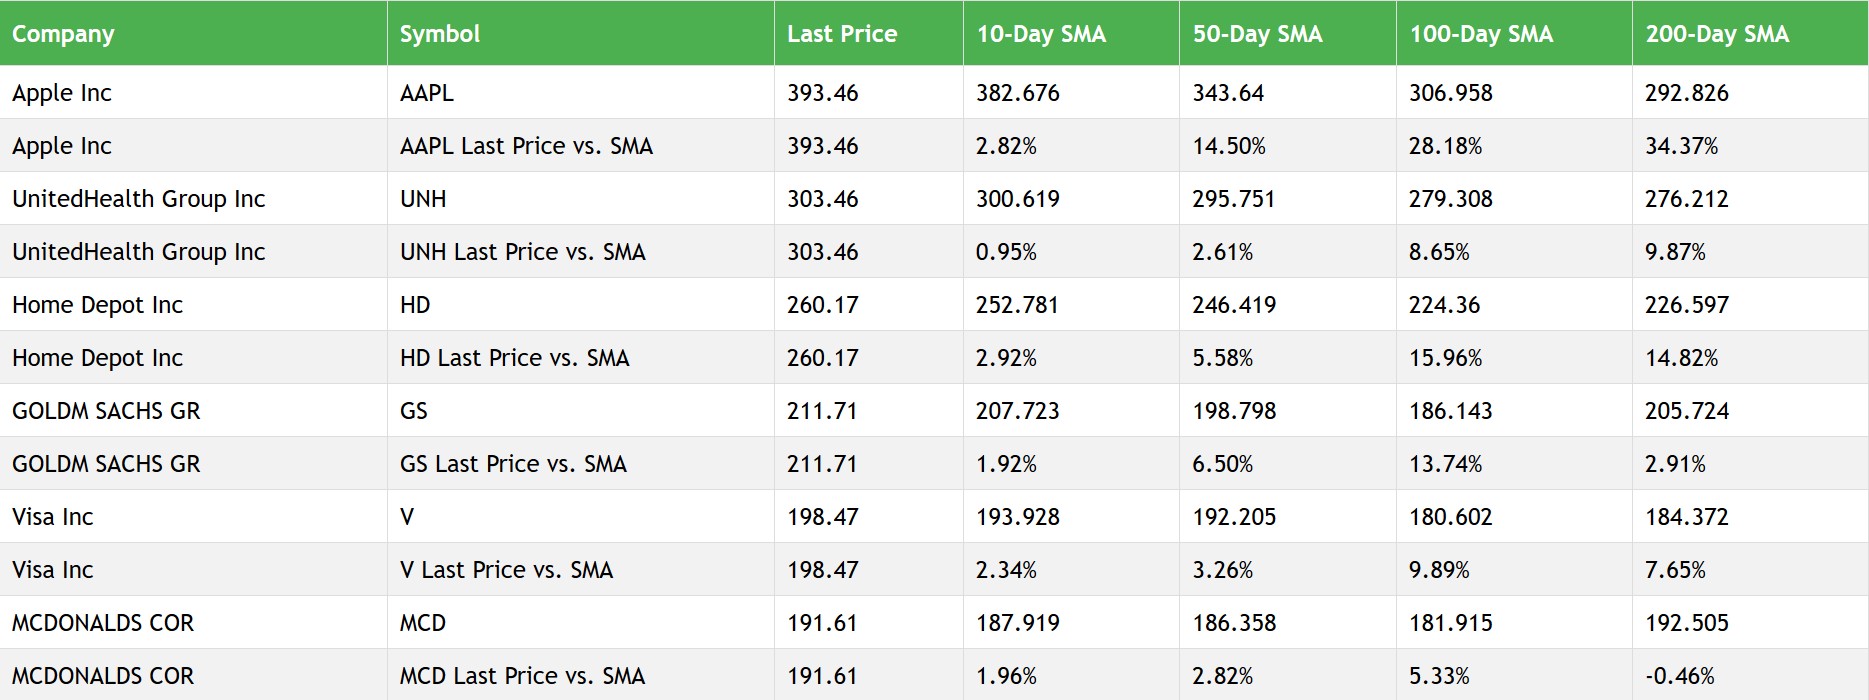
From a technical analysis point of view, I am not fully convinced this is the perfect trade. The Simple Moving Averages are screaming a sell while some of the oscillators are signalling a buy. Overall the technical indicators are flashing a sell signal.  

Exhibit: Charles Schwab Technical Indicators - August 8, 2020 

(Source: Tradingview

The stock was trading near the lower price range of its Bollinger Bands and had a double bottom. That, along with the fundamentals, is what prompted me to buy the shares. 

Exhibit: Charles Schwab's Double Bottom

(Source: Tradingview

(Disclosure: I own Charles Schwab)


Tuesday, August 4, 2020

What is wrong with 3M?

I am going to break the suspense and answer the question in the title: "There's nothing wrong with 3M!" Its earnings for the quarter that ended June 2020 was exception given the tough circumstances under which every company in the world has been operating this year. Its GAAP EPS was $2.22 for Q2 2020 against an estimate of $1.80. Its revenue of $7.18 billion missed estimates by just $110 million. Complete industries in this era of the pandemic are in a free-fall and here we are punishing an essential, iconic American company for missing revenue by an amount, which would be 1.5% of the $7.18 billion.

Exhibit: 3M Q2 2020 Sales Declined by 13.1%

(Source: SeekingAlpha)

Yes, there was broad weakness in sales across all their business segments. But the company has been aggressive in reducing costs and was able to improve adjusted EBITDA margin by 110 basis points to 26.5%. Their operating cash flow increased 15% year-over-year to $1.9 billion. The management even paid down debt by $1.7 billion since the March 31, 2020 quarter.
The stock has been punished after the earnings. It has dropped from about $163 and trades a little over $151 as of August 4th. 

Exhibit: 3M Technical Indicators are Flashing a Strong Sell on August 4, 2020.

(Source: Tradingview)

Currently, the technical indicators are all flashing a strong sell signal. The market seems to be giving-up on 3M. But the Bollinger Bands are tightening and this raises the possibility of a sharp price move in either direction. Given that the other technical signals are flashing sell, tightening Bollinger Bands could indicate a drop from this level.

Exhibit: 3M Bollinger Bands are Tightening.

(Source: Tradingview)

(Disclosure: I do not own 3M)


Caterpillar May be a Buy at around $131

Caterpillar (CAT) may be signalling a buy at around $131. This could be short term trade and the exit could be around $140, where the stock could face resistance. Bollinger Bands indicate that the stock is relatively cheap at around $131. There was a 30% upside on reported earnings compared to Wall Street estimates. EPS on Jul 31, 2020 was $0.84 compared to estimate of $0.64.  The earning beat indicate that the stock can go higher in the short-term. 

Exhibit: CAT's SMA is mostly bullish and Bollinger Bands indicate relative low prices.

(Source: Tradingview)
(Disclosure: I own CAT)   

Wednesday, July 29, 2020

Big Tech is Taking a Break From the Rally

    Both Apple (AAPL) and Microsoft (MSFT) are trading below its 10-day moving average. Apple is down from its 52-week high of $399.82 and currently trades at $380.16. That's a drop from the 52-week high of - 4.97%. Apple's 10-day moving average is 382.436 (Tuesday, July 28, 2020). Microsoft is down from $216.38 to $204.06 that's a -5.6% change. Its 10-day moving average is $202.15. Amazon (AMZN), Facebook (FB), and Alphabet (GOOG) are all trading below their 10-day moving average. Out of this cohort only Facebook is trading below its 50-day moving average. 

Exhibit: Big Tech's Downturn has Started. When will it end? 


(Source: SECURFII)


    Microsoft has gained 53% from its lows in March 2020. Apple has gained 76% form its March 2020 lows.  The gains have been spectacular. Google has gained 50% from its March lows. Amazon has gained nearly 82% from its March 2020 lows.     

    It seems like all these stocks are starting a downward trend after the huge run-up they have had over the last few years and the rebound they have had since the pandemic induced crash of March 2020.           

Tuesday, July 28, 2020

Boeing Lost Support at 50-Day Moving Average In a Bearish Sign For the Stock

Boeing has lost support at the 50-day moving average. This is a bearish sign for the stock.

Exhibit: Boeing's Simple Moving Average (Data based on Monday, July 27, 2020)


(Source: Secure Your Financial Independence - DJIA SMA Report)

Boeing is currently trading at $169.26. There seems to be support at this level. If it loses support here, then Boeing may drop all the way to $120 for the next support level.  Given the bad news at Boeing, it is entirely possible that it will touch $120 in the coming weeks or months. 

Exhibit: Boeing Has Support at $169. If it loses this support, it may drop all the way to $120. 


(Source: SeekingAlpha & Author Annotations)

    Boeing recently announced that it will delay its 777x jet by up to an year. Even before the pandemic, Boeing was dealing with the problems with its 737 Max jets. When the pandemic hit, it grounded the entire travel industry. It now seems like it may take years before the travel industry can fully recover. It may take a couple of years after travel gets back to 2019 level that Boeing will start to get new orders for jets. There's so much excess inventory of jets across the globe that airlines may put off buying new jets for years. Combine this with the problem of airlines going bankrupt and you have lesser number of customers to chase for new jet orders.  Given all these factors, it's entirely plausible that Boeing's stock could give-up much of its gain since May 2020 and retrace to $120. If it loses support at $120, it may test its lows below $100.
    This crisis is a real test of leadership. Boeing is such an iconic company that it's painful to see this downfall. I am confident that in 3-5 years Boeing will be in much better shape.
(Disclosure: I own Boeing)        


Tuesday, July 21, 2020

Visa, Home Depot, and Nike are a Buy Based on Simple Moving Average

    Home Depot (HD), Visa (V), and Nike (NKE) are buys at these levels when you consider only the 50-Day and 200-Day simple moving averages of all the stocks in the Dow Jones Industrial Average. Nike's 50-day simple moving average (SMA) is greater than its 200-day SMA. That's considered a bullish signal for the stock. Its 10-day SMA is greater than both its 50-day and 200-day. Both Visa and Home Depot exhibit the Golden Cross pattern where the 50-day SMA exceeds the 200-day SMA. But, based on fundamentals are they too expensive? 

Exhibit: Simple Moving Average May be Indicating that Nike is Buy
    

(Source: Securfii)

Exhibit: Simple Moving Average May be Indicating that Home Depot and Visa are a Buy


(Source: Securfii)

Nike is currently trading at 40x forward earnings. Home Depot is trading at 25x forward earnings and Visa is trading at 39x forward earnings. From a fundamental perspective all three companies are trading at a premium. But, on the other hand all three companies are one-of-a-kind in the world. Nike has an incomparable brand that is cherished across the globe. Visa has global network effects that cannot be easily replicated.  Home Depot's biggest strength may be its operational excellence.
Disclosure: I do not currently own HD, V, and NKE.


Monday, July 20, 2020

Goldman Sachs Looks Attractive Based on Moving Averages and Q2 Results

    The Goldman Sachs (NYSE: GS) is on the move - both the company and the stock. As of July 20th, 2020, the stock is currently trading above its 10-day, 50-day, 100-day, and 200-day moving averages. Even thought the 50-day moving average is below the 200-day moving average, I believe it's just a matter of time when the 50-day moving average crosses the 200-day moving average. On top of that the company reported blockbuster earnings in Q2, FY 2020. The company reported its second highest quarterly net revenue in its history. Revenues were up 41% compared to Q2 FY 2019.

Exhibit: Goldman Sachs Q2 FY 2020 Results Snapshot


(Source: SeekingAlpha)

Exhibit: Goldman Sachs Revenue Grew by 41% in Q2 FY 2020

(Source: SeekingAlpha)

    Goldman Sachs has been busy launching new products and services bringing innovation to the field. They have launched a new cloud-based transaction banking service that would bring modern treasury services and working capital management for customers worldwide. They have also launched a new buyout fund.      

Exhibit: Moving Averages for Goldman Sachs is Bullish     


(Source: SECURFII)

Disclosure: I own Goldman Sachs.

Sunday, July 19, 2020

Simple Moving Average of All 30 Stocks in the Dow Jones Industrial Average

    Moving averages can be powerful momentum indicator for stock price movements. The simple moving average provides a way to find attractive entry points for stock. For example, the golden cross is a bullish signal for a stock when its short-term moving average breaks above a long-term one. For example, when a 50-day moving average crosses above the 200-day moving average. I have created a website that generates the simple moving average of all stocks in the Dow Jones Industrial Average.  This report will be generated daily after market close and can help you get ready for the next trading day. This report generates the 10-Day, 50-Day, 100-Day, 200-Day moving average of stocks in the DJIA.  It also compares the moving average price against the last price of that stock.  This gives you a perspective on where the last stock price stands in relationship to the moving averages.
                   Exhibit: Sample of the Simple Moving Average Report 

(Source: securfii.com)


Paccar: Peak Demand For Trucks

 Paccar ( PCAR ) produced 185,900 trucks in 2022 and is on track for another record year in 2023. The company has experienced good revenue ...