Wednesday, September 21, 2022

Linear Regression of Monthly Returns of Sealed Air Corp and the Vanguard S&P 500 Index ETF

Sealed Air Corporation is a global provider of packaging solutions to various industries. The company provides various packaging products to pack red meat, medical and life science products, cheese, electronics, and other products.  

Exhibit: Sealed Air Corporation Revenue by Region and Product Type

Exhibit: Sealed Air Corporation Packaging Products Revenue by Region and Product Type
(Source: Sealed Air Q2 FY 2022 Investor Presentation on August 2,2022)

Sealed Air has very high volatility. This high volatility may be due to heavy dependency on consumer spending. If consumer spending is weak, they may buy less packaged red meat or packaged cheese, resulting in reduced revenue for the company.  

Here is the graph of monthly returns of Sealed Air (SEE) plotted against Vanguard S&P 500 Index ETF (VOO):
Exhibit 1: Monthly Returns of Sealed Air Corp. and Vanguard S&P 500 Index ETF [June 2019 -  August 2022]
Monthly Returns of Sealed Air Corp. and Vanguard S&P 500 Index ETF [June 2019 -  August 2022]
Monthly Returns of Sealed Air Corp. and Vanguard S&P 500 Index ETF [June 2019 -  August 2022]
(Source: RStudio, ggplot, Data Provided by IEX Cloud)


Results of the linear regression of monthly returns of Sealed Air Corporation against Vanguard S&P 500 Index ETF:

> lmSEEVOO = lm(SEE_Monthly_Return~VOO_Monthly_Return, data = VOOandSEE)
> summary(lmSEEVOO)

Call:
lm(formula = SEE_Monthly_Return ~ VOO_Monthly_Return, data = VOOandSEE)

Residuals:
     Min       1Q   Median       3Q      Max 
-0.13572 -0.03866  0.01319  0.03375  0.14587 

Coefficients:
                    Estimate Std. Error t value Pr(>|t|)    
(Intercept)        -0.002498   0.009056  -0.276    0.784    
VOO_Monthly_Return  1.144479   0.163536   6.998 2.85e-08 ***
---
Signif. codes:  0 ‘***’ 0.001 ‘**’ 0.01 ‘*’ 0.05 ‘.’ 0.1 ‘ ’ 1

Residual standard error: 0.05547 on 37 degrees of freedom
Multiple R-squared:  0.5696, Adjusted R-squared:  0.558 
F-statistic: 48.98 on 1 and 37 DF,  p-value: 2.849e-08

Sealed Air Corporation has a higher volatility than the S&P 500 Index, with a Beta of 1.144. The company's monthly returns positively correlate with the Vanguard S&P 500 Index ETF. The correlation is 0.75.  
The linear regression yields an adjusted R-squared of 0.55, indicating that about 55% of Sealed Air's monthly returns can be explained by the monthly returns of the S&P 500 Index. 
Sealed Air stock may be risky due to its high volatility compared to the market. But, if the stocks are bought at a reasonable or low valuation, they may yield returns that exceed the market's return.   


Tuesday, September 20, 2022

Linear Regression of Monthly Returns of Cisco Systems and the Vanguard S&P 500 Index ETF

Here is the graph of monthly returns of Cisco Systems (CSCO) plotted against Vanguard S&P 500 Index ETF (VOO):

Exhibit 1: Monthly Returns of Cisco Systems and Vanguard S&P 500 Index ETF [June 2019 -  August 2022]

Monthly Returns of the Vanguard S&P 500 Index ETF and Cisco Systems
Monthly Returns of the Vanguard S&P 500 Index ETF and Cisco Systems Inc.

(Source: RStudio, ggplot, Data Provided by IEX Cloud)

Results of the linear regression of monthly returns of Cisco Systems against Vanguard S&P 500 Index ETF:

VOOandCSCO <- read_excel("/CSCO_VOO_LM_September_2022.xlsx", sheet = "Sheet1")
lmCSCOVOO = lm(CSCO_Monthly_Return~VOO_Monthly_Return, data = VOOandCSCO)
summary(lmCSCOVOO)

Call:
lm(formula = CSCO_Monthly_Return ~ VOO_Monthly_Return, data = VOOandCSCO)

Residuals:
      Min        1Q    Median        3Q       Max 
-0.156924 -0.031998 -0.008248  0.038045  0.127839 

Coefficients:
                   Estimate Std. Error t value Pr(>|t|)    
(Intercept)        -0.01062    0.01049  -1.012    0.318    
VOO_Monthly_Return  0.91708    0.18946   4.841 2.31e-05 ***
---
Signif. codes:  0 ‘***’ 0.001 ‘**’ 0.01 ‘*’ 0.05 ‘.’ 0.1 ‘ ’ 1

Residual standard error: 0.06426 on 37 degrees of freedom
Multiple R-squared:  0.3877, Adjusted R-squared:  0.3712 
F-statistic: 23.43 on 1 and 37 DF,  p-value: 2.306e-05

The slope of the regression corresponds to the beta of the stock. In this case, Cisco Systems has a beta of 0.91. 
The adjusted R-squared is 0.37. About 37% of Cisco's monthly return is explained by the returns of the S&P 500 index.  
Cisco Systems cannot protect a portfolio against market volatility since it has a beta value close to 1. Cisco's stock will almost entirely reflect the volatility in the market.      


Sunday, September 18, 2022

Musings on Economic Growth, Buybacks, and Inflation

We are entering an era of slow growth, especially in the U.S. and Europe. The older demographics and lower productivity are to blame for the low growth. Economic growth was already slow in the 2010s, but artificially low-interest rates from the Fed caused multiple expansions in the stock market. I see these Asset Managers and VCs criticize the Fed and the Government for inflation today, but those guys did not give credit to the Fed and the Government for all the billions they made in profits due to the cheap money policies. Homeowners benefited from the artificially low-interest rates, but most would never call it a hand-out.

Business Insider is reporting that the corporate bond market is in deep trouble. CEOs spent $1 trillion on share buybacks each year to pad their income while their company's balance sheets deteriorated. Oracle spent over 85% of its operating cash flow on share repurchases. Even after all these buybacks, Oracle's stock is way down. No amount of financial engineering can save a company with zero revenue growth.

Oracle can afford buybacks, but many other companies were spending more than their operating cash flow on buybacks and dividends. Essentially, they borrowed money at ultra-low interest rates to fund their buybacks. Even after all these buybacks, Oracle's stock is way down. No amount of financial engineering can save a company with zero revenue growth.

The Biden administration should not bail out corporations for their mistakes and let companies go through the bankruptcy process for the way they mishandled shareholder wealth. We might see a wave of bankruptcies next year (2023). Let's return to our capitalist roots.  It was a mistake to bail out AIG with $170 billion during the 2008 crisis. We spent trillions bailing out corporations for their mistakes in both 2008 and again in 2020.  The US airlines went bankrupt in a week during March 2020.  The US airlines spent all their money on buybacks and had nothing saved for a rainy day. I saw this ad from a Japanese company during the 2020 COVID crisis. They asked applicants to apply to their company and said employees need not worry about getting paid.  They said they have enough money on their balance sheet to pay every employee even if they had zero revenues for 20 years.

Most of the inflation is caused by supply chain disruptions to food supplies and other essentials. No amount of lowering the money supply will reign in inflation caused by supply chain disruptions in food unless we want people to suffer from hunger.

Our problem will be slower economic growth and not inflation a year from now (2023). Inflation will be high compared to the 2010s, but it will settle at a much lower level than its current rate of 6% to 8%. Even this higher level will most likely be due to supply-side challenges. The money supply is already contracting rapidly.

Monday, September 5, 2022

Linear Regression of Monthly Returns of Colgate-Palmolive against Vanguard S&P 500 Index ETF

Here is the graph of monthly returns of Colgate-Palmolive (CL) plotted against Vanguard S&P 500 Index ETF (VOO):

Exhibit 1: Monthly Returns of Colgate-Palmolive and Vanguard S&P 500 Index ETF [June 2019 -  August 2022]

(Source: RStudio, ggplot, Data Provided by IEX Cloud)

Results of the linear regression of monthly returns of Colgate-Palmolive against Vanguard S&P 500 Index ETF:

> VOOandCL <- read_excel("/CL_VOO_LM_September_2022.xlsx", sheet = "Sheet1")
lmCLVOO = lm(CL_Monthly_Return~VOO_Monthly_Return, data = VOOandCL)

> summary(lmCLVOO)

Call:
lm(formula = CL_Monthly_Return ~ VOO_Monthly_Return, data = VOOandCL)

Residuals:
      Min        1Q    Median        3Q       Max 
-0.084505 -0.025451  0.002263  0.028820  0.122836 

Coefficients:
                    Estimate Std. Error t value Pr(>|t|)   
(Intercept)        0.0002236  0.0067940   0.033  0.97392   
VOO_Monthly_Return 0.3471172  0.1226847   2.829  0.00749 **
---
Signif. codes:  0 ‘***’ 0.001 ‘**’ 0.01 ‘*’ 0.05 ‘.’ 0.1 ‘ ’ 1

Residual standard error: 0.04161 on 37 degrees of freedom
Multiple R-squared:  0.1779, Adjusted R-squared:  0.1557 
F-statistic: 8.005 on 1 and 37 DF,  p-value: 0.007492

The slope of the regression corresponds to the beta of the stock. In this case, Colgate-Palmolive has a beta of 0.34. 
The adjusted R-squared is 0.15. About 15% of Colgate-Palmolive's return is explained by the returns of the S&P 500 index.  
Colgate-Palmolive can protect a portfolio against market volatility since it has a beta value substantially less than 1.    


Saturday, September 3, 2022

Linear Regression of Monthly Returns of Lennox International against Vanguard S&P 500 Index ETF

Here is the graph of monthly returns of Lennox International (LII) plotted against Vanguard S&P 500 Index ETF (VOO):

Exhibit 1: Monthly Returns of Lennox International and Vanguard S&P 500 Index ETF [June 2019 -  August 2022 


(Source: RStudio, ggplot, Data Provided by IEX Cloud)

Results of the linear regression of monthly returns of Lennox International against Vanguard S&P 500 Index ETF:

VOOandLII <- read_excel("/LII_VOO_LM_September_2022.xlsx", sheet = "Sheet1")

lmLIIVOO = lm(LII_Monthly_Return~VOO_Monthly_Return, data = VOOandLII)

> summary(lmLIIVOO)

Call:
lm(formula = LII_Monthly_Return ~ VOO_Monthly_Return, data = VOOandLII)

Residuals:
      Min        1Q    Median        3Q       Max 
-0.090246 -0.052733 -0.001907  0.040310  0.108446 

Coefficients:
                    Estimate Std. Error t value Pr(>|t|)    
(Intercept)        -0.010082   0.009416  -1.071    0.291    
VOO_Monthly_Return  0.995050   0.170040   5.852 9.97e-07 ***
---
Signif. codes:  0 ‘***’ 0.001 ‘**’ 0.01 ‘*’ 0.05 ‘.’ 0.1 ‘ ’ 1

Residual standard error: 0.05767 on 37 degrees of freedom
Multiple R-squared:  0.4807, Adjusted R-squared:  0.4666 
F-statistic: 34.24 on 1 and 37 DF,  p-value: 9.966e-07

The slope of the regression corresponds to the beta of the stock. In this case, Lennox International has a beta of 0.995. Lennox's beta is close to the S&P 500 beta, so Lennox will move in line with the market.  

The adjusted R-squared is 0.46. About 46% of Lennox's return is explained by the returns of the S&P 500 index.  


Saturday, February 26, 2022

Welch Two Sample t-test of Daily Price Returns of J.M. Smucker and Mondelez

J.M. Smucker and Mondelez are consumer staples companies with similar financial performance. Both companies compete in similar product categories, especially when it relates to snacks. But, Mondelez has a vast international operation, while J. M. Smucker is more focused on the U.S. with very little So, I wanted to see if the mean daily returns are the same between the two stocks.

First, I downloaded the daily price return data for the past six months for both J.M. Smucker (SJM) and Mondelez (MDLZ) from IEX Cloud

I did a correlation between the daily price returns of the two companies using R:

> cor(SJM_6Month_ClosingPrice_Daily_Return_Data$changePercent, MDLZ_6Month_ClosingPrice_Daily_Return_Data$changePercent) 

[1] 0.5815403

The correlation in the daily returns between the two companies was 0.58 for the past six months. It is a positive correlation, but I would not consider this as a strong correlation in returns between the two companies. I would consider it a strong correlation if it was at or above 0.70. This came as a surprise given that both the companies are in the consumer staples sector and that sector has performed very well since December 2021. 

Next, I wanted to calculate the p-value for the Welch two-sample t-test between means of the daily returns.  The null hypothesis is that the difference in mean daily returns between J.M. Smucker and Mondelez is zero. The alternate hypothesis is that the difference is not zero. The p-value is 0.9035, which means the null hypothesis can be resoundingly rejected. The t-test command in R and the result set is presented below. The J. M. Smucker had a mean daily return of 0.0893% and Mondelez had a daily return of 0.0717%. There is a 1.7 basis points difference in returns with J. M. Smucker having a slightly larger daily return than Mondelez.       

> t.test(SJM_6Month_ClosingPrice_Daily_Return_Data$changePercent,         MDLZ_6Month_ClosingPrice_Daily_Return_Data$changePercent)

Welch Two Sample t-test

data:  SJM_6Month_ClosingPrice_Daily_Return_Data$changePercent and MDLZ_6Month_ClosingPrice_Daily_Return_Data$changePercent

t = 0.1214, df = 239.4, p-value = 0.9035

alternative hypothesis: true difference in means is not equal to 0

95 percent confidence interval:

 -0.002682718  0.003035099

sample estimates:

   mean of x    mean of y 

0.0008936508 0.0007174603 

Finally, here's the scatter plot of daily price change of J.M. Smucker (SJM) and Mondelez (MDLZ).

(Data Source: IEXCloud.io, Plot Created using RStudio)


Monday, January 31, 2022

Copper Prices at 5-Week Lows. Is this a Bad Sign for the Global Economy?

Aluminum and copper prices are a study in contrast. Aluminum is trading near all-time highs (See Exhibit 1: Aluminum Trading Near All-time High Price) while copper's rally is beginning to fade. Copper is trading at 5-week lows.  

Exhibit 1: Aluminum Trading Near All-time High Price

According to Trading Economics, low inventory levels, the power crisis in Europe, and Ukraine-Russia tensions are all to blame for this incredible rally in aluminum.

Meanwhile, copper prices are at five-week lows due to the strong dollar and increased production. Trading Economics reports that Chilean authorities are projecting that copper production will increase by 4.1% during 2022, returning to pre-pandemic levels. Even at its current price of $4.32/lb, copper is trading at all-time highs (See Exhibit 2: Copper Prices at 5-Week Lows). I am watching copper see if it falls below $4/lb. Falling below that price level may be a bearing sign not only for copper but for the world economy.

Exhibit 2: Copper Prices are at 5-Week Lows


If copper continues to fall, the stock prices for miners, such as Rio Tinto (RIO), might fall with it. The share price of Rio Tinto has tumbled about 9% from its peak of approximately $78.48 achieved in mid-January (See Exhibit 3: Rio Tinto's Share Price Takes a Hit in January).

Exhibit 3: Rio Tinto's Share Price Takes a Hit in January

(Source: Seeking Alpha)


Friday, January 28, 2022

Invest in an Equal-Weight ETF in these Turbulent Times.

The S&P 500 index is market-capitalization-weighted. The weighting by market cap means the companies with the largest market capitalization (Market capitalization = Number of shares outstanding x Share Price) get the highest weight. Last year, this method for calculating the index made the five largest companies by market cap account for 23% of the index. That is just 5 out of the 500 companies accounting for about a quarter of the market capitalization. These five companies were: Apple, Microsoft, Alphabet (Google), Amazon, and Facebook (Meta). When the share price of these companies starts underperforming, the market takes a huge tumble. We can see that happening now. The S&P 500 index (VOO) is down about 9.72% (pre-market on January 28), while the S&P 500 equal-weighted ETF (RSP) is down 7.48% (See Exhibit 1: Invesco Equal-Weight ETF Beats Vanguard S&P 500 Market-Cap Weighted ETF). That is a difference in the performance of 224 basis points. In essence, the equal-weight ETF outperformed the market-cap ETF. The dividend yield is about the same for both ETFs. The Invesco Equal-Weight ETF charges a higher expense ratio than the Vanguard S&P 500 ETF. Invesco charges 20 basis points (bps) or 0.2%, while the Vanguard S&P 500 ETF (VOO) charges three bps or 0.03%. Invesco charges 7x more than the Vanguard ETF. Even after deducting the extra expense of investing in the Invesco ETF, it comes ahead in performance by over 200 bps.  

The era of big-tech is coming to an end due to more regulation and their size inhibiting growth. At least for now, Apple seems to be bucking the trend after reporting blockbuster results yesterday. Interest rates are also rising, putting pressure on valuation because future earnings will be discounted at a higher interest rate. It may be good to have a position in the Invesco Equal-Weight ETF (RSP) during these times. 

     Exhibit 1: Invesco Equal-Weight ETF Beats Vanguard S&P 500 Market-Cap Weighted ETF
(Source: Seeking Alpha)
Also, there may be other equal-weight ETFs in the market. I am aware of Invesco's ETF, so I have invested in it. I am not endorsing the Invesco ETF. 

Monday, January 3, 2022

Few Things to Know About Our Current Energy Transition from Fossil Fuels to Renewables.

In a discussion hosted by Bridgewater Associates (the world's largest hedge fund), Daniel Yergin discussed the current energy transition, geopolitics, and government. Daniel Yergin emphasizes a few things about our energy transition:

  • Energy transition to oil from coal took nearly a hundred years. 
  • Instead of trying to control oil supplies, now we are trying to control materials used in batteries and solar panels. Increasing lithium and cobalt prices pose a challenge for electric vehicles. 
  • Electric vehicles may need subsidies to make them affordable. 

Governments can offer subsidies, but the loss of revenue due to the subsidies need to be compensated by higher taxes, lower social benefits, or higher deficits. The world is grappling with excessive debt levels and does not have the flexibility to take on more deficit spending. Take the example of Japan, where the outstanding government bonds have crossed one thousand trillion yen for the first time.    

You can watch the Daniel Yergin discussion on YouTube.  

Paccar: Peak Demand For Trucks

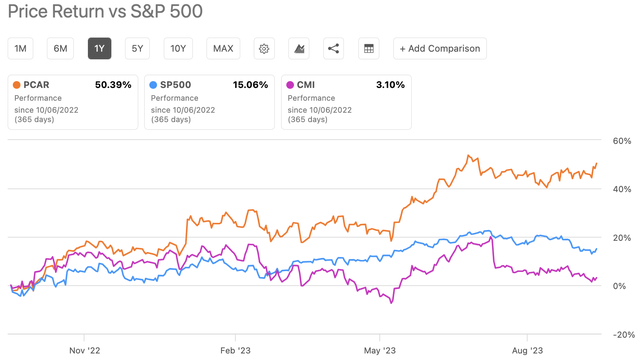
 Paccar ( PCAR ) produced 185,900 trucks in 2022 and is on track for another record year in 2023. The company has experienced good revenue ...