Showing posts with label Beta. Show all posts

Monday, September 5, 2022

Linear Regression of Monthly Returns of Colgate-Palmolive against Vanguard S&P 500 Index ETF

Here is the graph of monthly returns of Colgate-Palmolive (CL) plotted against Vanguard S&P 500 Index ETF (VOO):

Exhibit 1: Monthly Returns of Colgate-Palmolive and Vanguard S&P 500 Index ETF [June 2019 -  August 2022]

(Source: RStudio, ggplot, Data Provided by IEX Cloud)

Results of the linear regression of monthly returns of Colgate-Palmolive against Vanguard S&P 500 Index ETF:

> VOOandCL <- read_excel("/CL_VOO_LM_September_2022.xlsx", sheet = "Sheet1")
lmCLVOO = lm(CL_Monthly_Return~VOO_Monthly_Return, data = VOOandCL)

> summary(lmCLVOO)

Call:
lm(formula = CL_Monthly_Return ~ VOO_Monthly_Return, data = VOOandCL)

Residuals:
      Min        1Q    Median        3Q       Max 
-0.084505 -0.025451  0.002263  0.028820  0.122836 

Coefficients:
                    Estimate Std. Error t value Pr(>|t|)   
(Intercept)        0.0002236  0.0067940   0.033  0.97392   
VOO_Monthly_Return 0.3471172  0.1226847   2.829  0.00749 **
---
Signif. codes:  0 ‘***’ 0.001 ‘**’ 0.01 ‘*’ 0.05 ‘.’ 0.1 ‘ ’ 1

Residual standard error: 0.04161 on 37 degrees of freedom
Multiple R-squared:  0.1779, Adjusted R-squared:  0.1557 
F-statistic: 8.005 on 1 and 37 DF,  p-value: 0.007492

The slope of the regression corresponds to the beta of the stock. In this case, Colgate-Palmolive has a beta of 0.34. 
The adjusted R-squared is 0.15. About 15% of Colgate-Palmolive's return is explained by the returns of the S&P 500 index.  
Colgate-Palmolive can protect a portfolio against market volatility since it has a beta value substantially less than 1.    


Saturday, September 3, 2022

Linear Regression of Monthly Returns of Lennox International against Vanguard S&P 500 Index ETF

Here is the graph of monthly returns of Lennox International (LII) plotted against Vanguard S&P 500 Index ETF (VOO):

Exhibit 1: Monthly Returns of Lennox International and Vanguard S&P 500 Index ETF [June 2019 -  August 2022 


(Source: RStudio, ggplot, Data Provided by IEX Cloud)

Results of the linear regression of monthly returns of Lennox International against Vanguard S&P 500 Index ETF:

VOOandLII <- read_excel("/LII_VOO_LM_September_2022.xlsx", sheet = "Sheet1")

lmLIIVOO = lm(LII_Monthly_Return~VOO_Monthly_Return, data = VOOandLII)

> summary(lmLIIVOO)

Call:
lm(formula = LII_Monthly_Return ~ VOO_Monthly_Return, data = VOOandLII)

Residuals:
      Min        1Q    Median        3Q       Max 
-0.090246 -0.052733 -0.001907  0.040310  0.108446 

Coefficients:
                    Estimate Std. Error t value Pr(>|t|)    
(Intercept)        -0.010082   0.009416  -1.071    0.291    
VOO_Monthly_Return  0.995050   0.170040   5.852 9.97e-07 ***
---
Signif. codes:  0 ‘***’ 0.001 ‘**’ 0.01 ‘*’ 0.05 ‘.’ 0.1 ‘ ’ 1

Residual standard error: 0.05767 on 37 degrees of freedom
Multiple R-squared:  0.4807, Adjusted R-squared:  0.4666 
F-statistic: 34.24 on 1 and 37 DF,  p-value: 9.966e-07

The slope of the regression corresponds to the beta of the stock. In this case, Lennox International has a beta of 0.995. Lennox's beta is close to the S&P 500 beta, so Lennox will move in line with the market.  

The adjusted R-squared is 0.46. About 46% of Lennox's return is explained by the returns of the S&P 500 index.  


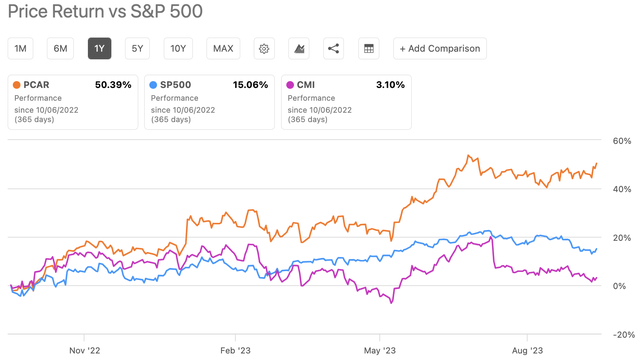
Paccar: Peak Demand For Trucks

 Paccar ( PCAR ) produced 185,900 trucks in 2022 and is on track for another record year in 2023. The company has experienced good revenue ...